
ORKUSTOFNUN GeoSciences Short Report GrB-ArH/01-05 grb![]()
November 6, 2001
HYDROLOGICAL MONITORING STATIONS IN BOREHOLES NEAR THE HUSAVIK-FLATEY FAULT ZONE
November 2000 to November 2001 performance
This short report describes the performance of an automated data logging system, which monitors hydrological parameters in wells near the Husavik-Flatey fault zone. A description on the system has already been given in an earlier short report (Grimur Bjornsson et.al., 2001: Hydrological Monitoring Stations In Boreholes Near The Husavik-Flatey Fault Zone. Installment and November to December 2000 performance. Orkustofnun short report GrB/EHH/ArH-01/01, 6p). This report is structured as follows. Firstly we describe the station locations and performance, including an unforseen relocation of station S-9 in Árnes to station S-12 in Tjörneshöfn. Secondly, we show the full data recorded by each of the stations. Thirdly, a few short-term events of particular importance are analyzed and discussed.
Table 1 describes the wells selected for the hydrological monitoring and Figure 1 shows their locations. All the wells in the table are the same as in early 2001, with the exemption that station S-9 has been relocated from Árnes to Tjörneshöfn. The reason for this action is unexpected and unforeseen, namely that the local farm community next to the well wanted to use it as a tap water supply. Without a notice, they pulled out the waterlevel and the temperature gauges and cut the sensors from their cables, causing a damage in excess of $10,000. Due to these hostile circumstances we decided to move the stations to a well in Tjörneshöfn. Despite a shallow depth, we know that the well is tight, except for a feedzone at approximately 90 m depth. That is considered adequate for the purpose of this project.
Table 1: Wells near the Husavik-Flatey fault zone selected for hydrological monitoring.
|
Well name |
Well ID |
Logger name |
Site name |
Depth (m) |
Location Hjörsey datum |
Well status |
|
FE-01 |
56811 |
S-8 |
Flatey |
555 |
66.163476 N 17.841316 W |
Non-artesian Waterlevel at 16.5 m |
|
AA-01 |
59701 |
S-9 |
Árnes |
1250 |
65.875338 N 17.405956 W |
Artesian flow of a few liters/minute |
|
ST-06 |
57226 |
S-10 |
Storu-Tjarnir |
595 |
65.709058 N 17.738454 W |
Artesian flow of a few liters/minute |
|
ST-07 |
57227 |
S-10 |
Storu-Tjarnir |
452 |
50 m to the south of ST-06 |
Closed most of the time and with pressure |
|
HU-04 |
51031 |
S-11 |
Husavik |
504 |
66.055088 N 17.347046 W |
Non-artesian Waterlevel at 15.75 m |
|
TJ-01 |
59501 |
S-12 |
Tjörneshöfn |
105 |
66.142570 N 17.263769 W |
Non-artesian Waterlevel at 5 m |
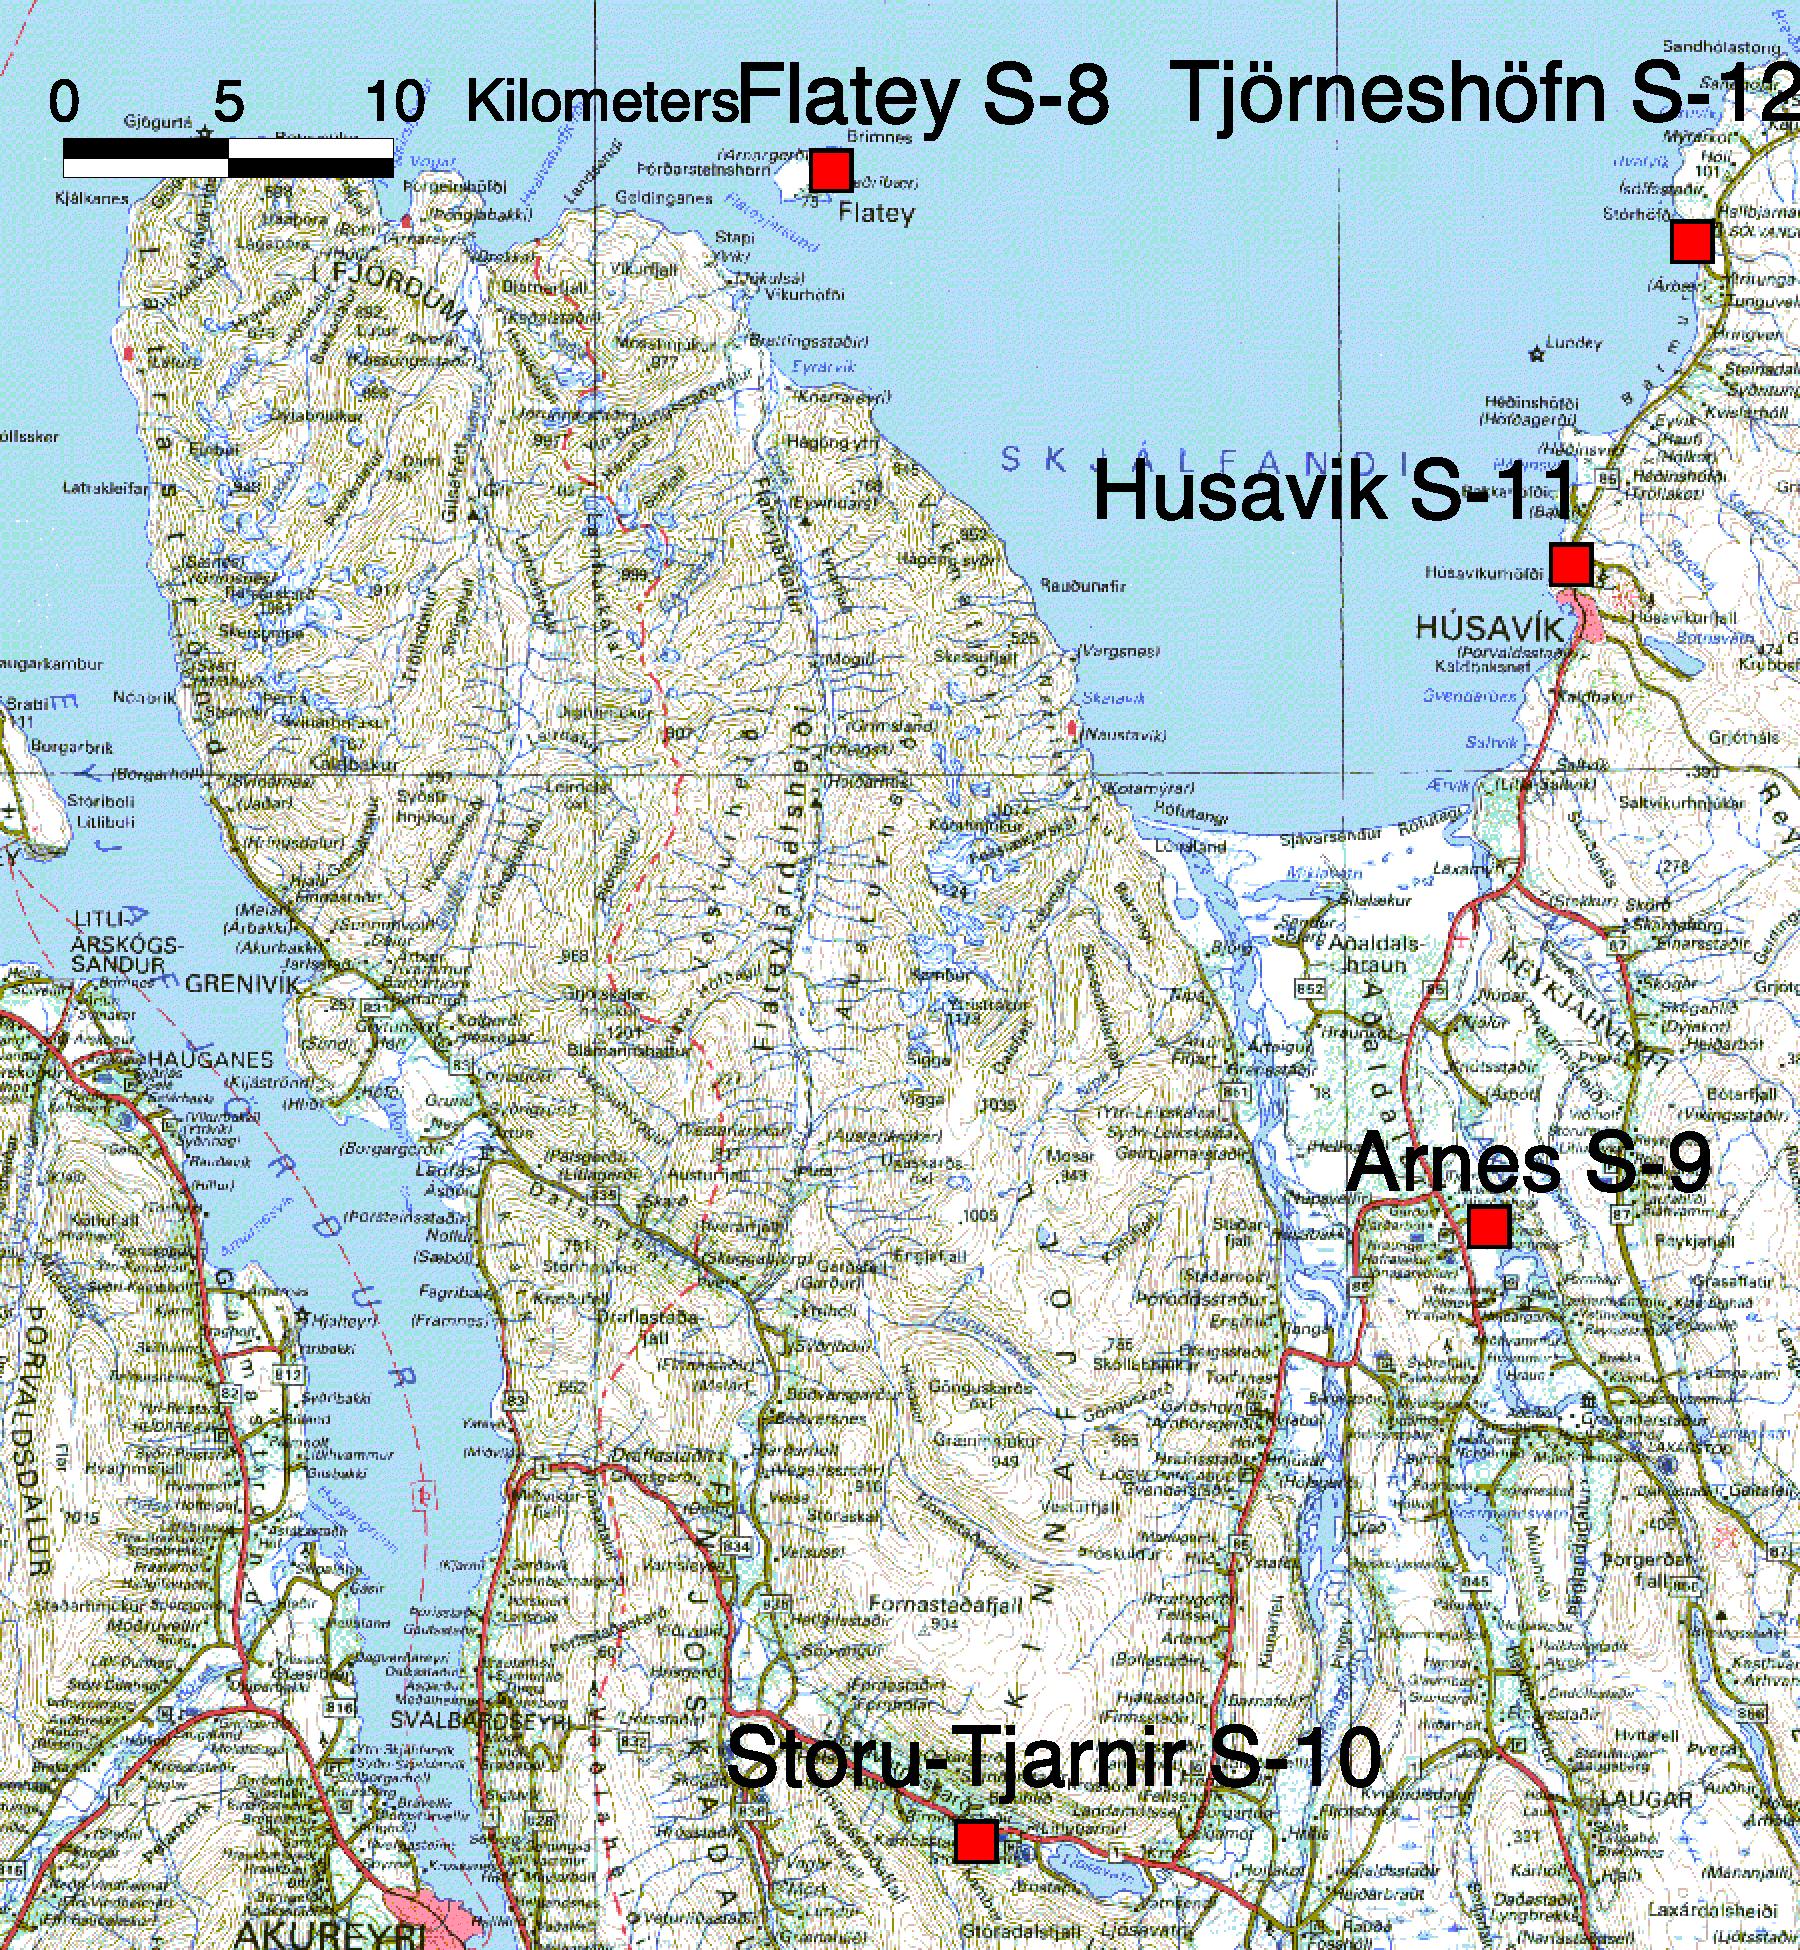
Figure 1: Location of the hydrological monitoring stations in N-Iceland
Figure 2 shows a full year record of pressure data from the well in Flatey, located next to the lighthouse on the island. The operation of this station has been very successful and at 100 % recovery rate. The pressure sensor is relative to barometric pressure. A dominant feature in the pressure record is the tidal fluctuations. But also of interest are spikes of lower pressure observed in early August and late October 2001. These changes are presumed to be of tectonic origin and correlate to a seismic event, taking place near Grimsey in early August 2001. Figure 3 shows quake epicenters collected during this time. Similarly, the low-pressure spike in late October correlates with a quake swarm, taking place in Öxarfjörður at the same time (Figure 4). Both events lead to dilatation of the rocks under Flatey. The symmetric pressure high, observed in December 2000 is, however, unexplained. Finally it should be mentioned that a green curve in the lower half of Figure 2 presents voltage of batteries used to run the lighthouse.
Note that the hydrological data for station S-8, as well as for the other stations in the north, can be readily accessed via our web-site www.os.is/ros/eftirlit.
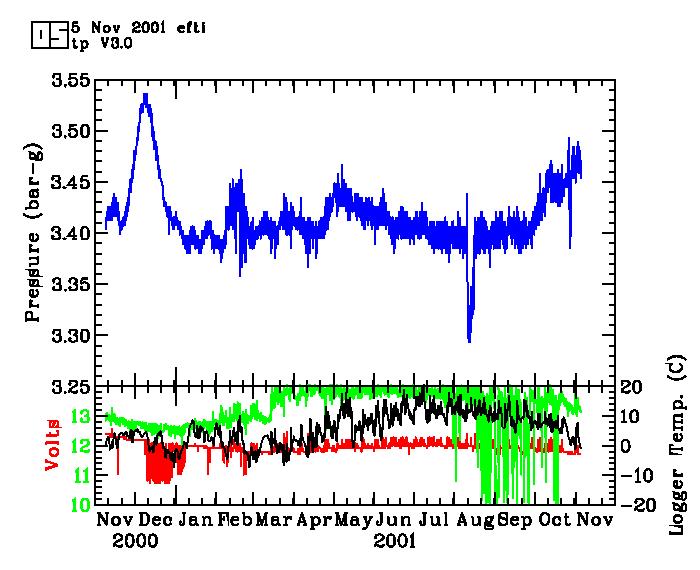
Figure 2: Observed pressure history (blue) for station S-8 in Flatey, during November 2000 to November 2001. Lower half of the graph shows logger status, red is voltage, black is temperature and green is voltage of the light house.
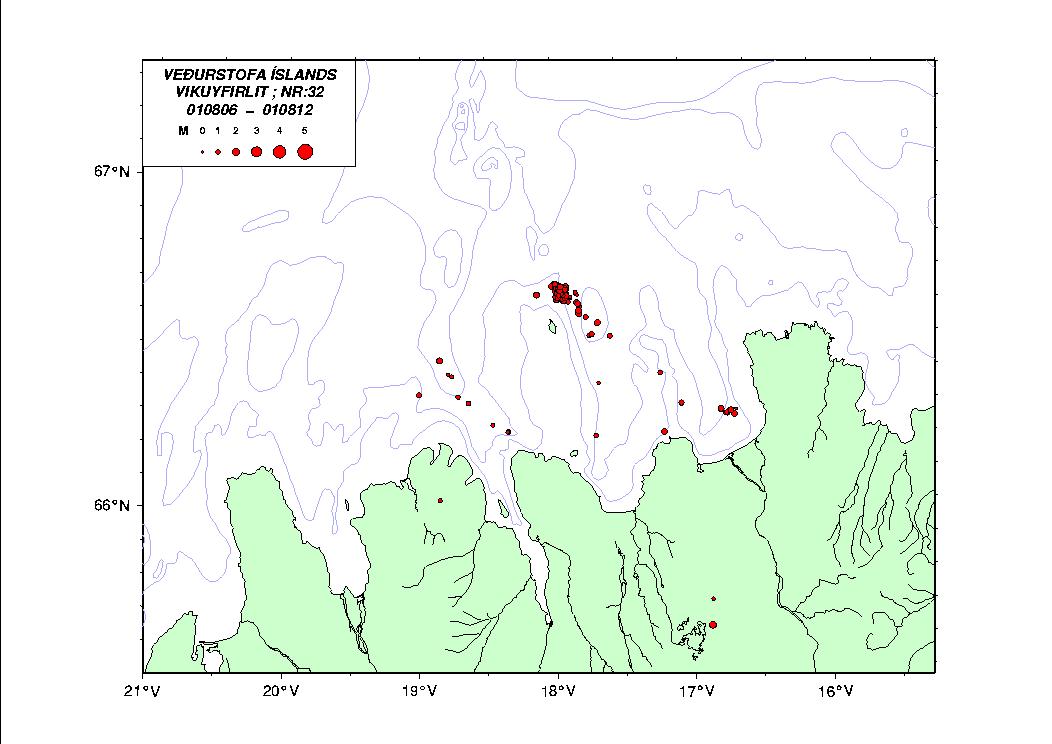
Figure 3: Quake activity in North-Iceland from August 6 to 12, 2001 (copied from the web site of the Meteorological Office: hraun.vedur.is/ja/viku/2001/vika_32/nor.gif).
Maximum activity to the NE of the Grimsey island.
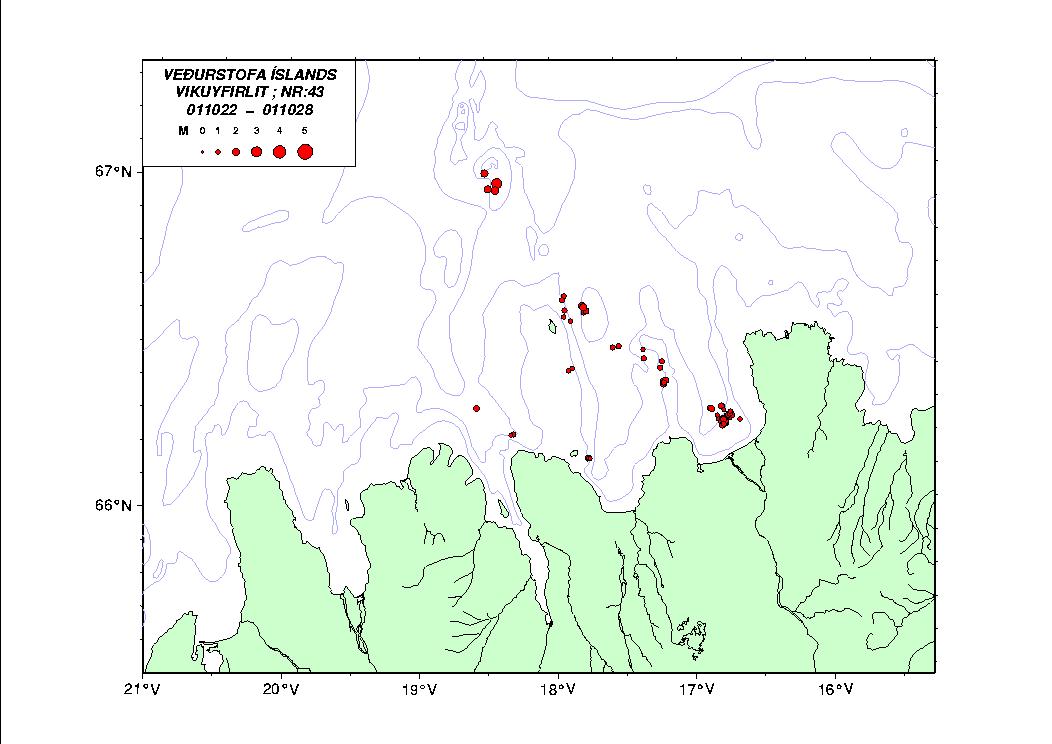
Figure 4: Quake activity in North-Iceland between October 22 and 28, 2001 (copied from the web site of the Meteorological Office: hraun.vedur.is/ja/viku/2001/vika_43/nor.gif)
Figure 5 presents pressure and temperature data for the artesian well in Árnes. This is the station, which was damaged by the local community and relocated. Two parameters are observed here, pressure at ~70 m depth (relative to barometric pressure) and the temperature of the artesian flow. The temperature gage only operated for 3 months and was replaced in June 2001. And in early August the pressure gauge was pulled out of the well as is clearly seen as a sharp drop in pressure. The gauge showed 0 bars while on surface, indicating that it was fully operational and correct. There are no obvious signs of tectonically originated pressure or temperature changes for this station. An exemption might be a slight pressure increase in early June 2001.
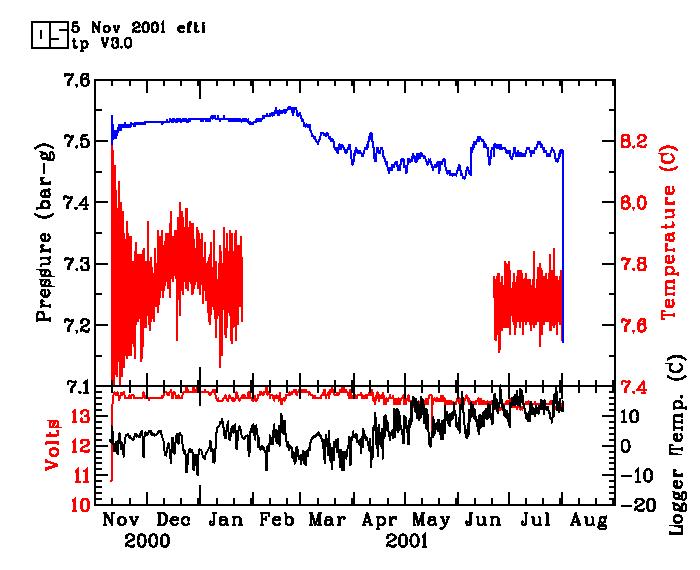
Figure 5: Observed pressure history (blue) and temperature (red) for station S-9 in Árnes, during November 2000 to August 2001.
Figure 6 shows hydrological data collected in wells 6 and 7 at Storu-Tjarnir. In total three parameters are collected, pressure at 70 m depth and temperature of the artesian well 6, and wellhead pressure of well 7. The pressure sensor in well 6 was initially the same type as in the wells in Flatey and Árnes (relative to barometric pressure). Unfortunately this sensor failed almost immediately in well 6 at Storu-Tjarnir. Likely explanation is a small concentration of non-condensable gases in the well, which have diffused into the gauge and harmed the fine electronics there. Also the station power supply, being recharged by a solar cell, failed from late December until late January when the battery was replaced in a special service trip to the site. Finally, in September 2001, cows and sheep chew up few of the cables attached to the hydrological station, causing like two weeks of data loss. During a service trip, the pressure sensor in well 6 was replace, and another battery added to the power supply. Despite these problems, the station has an up time of 80-90 %.
A dominant feature in the pressure signal of well 7 is a rapid cycling caused by occasional production from the well, during peak hours of the local district heating system. This feature is also seen in the discharge temperature of well 6, where a lower flowrate decreases the temperature. These spikes make the hydrological data harder to interpret. Two features are however of special interest and may have a connection with stress related reservoir permeability. Firstly that both the pressure of well 7 and the temperature of well 6 start to decline after mid July 2001. This happens despite no discharge from well 7. Secondly, two high-pressure spikes show up in the pressure of well 7 in early September, to be discussed in a later chapter.
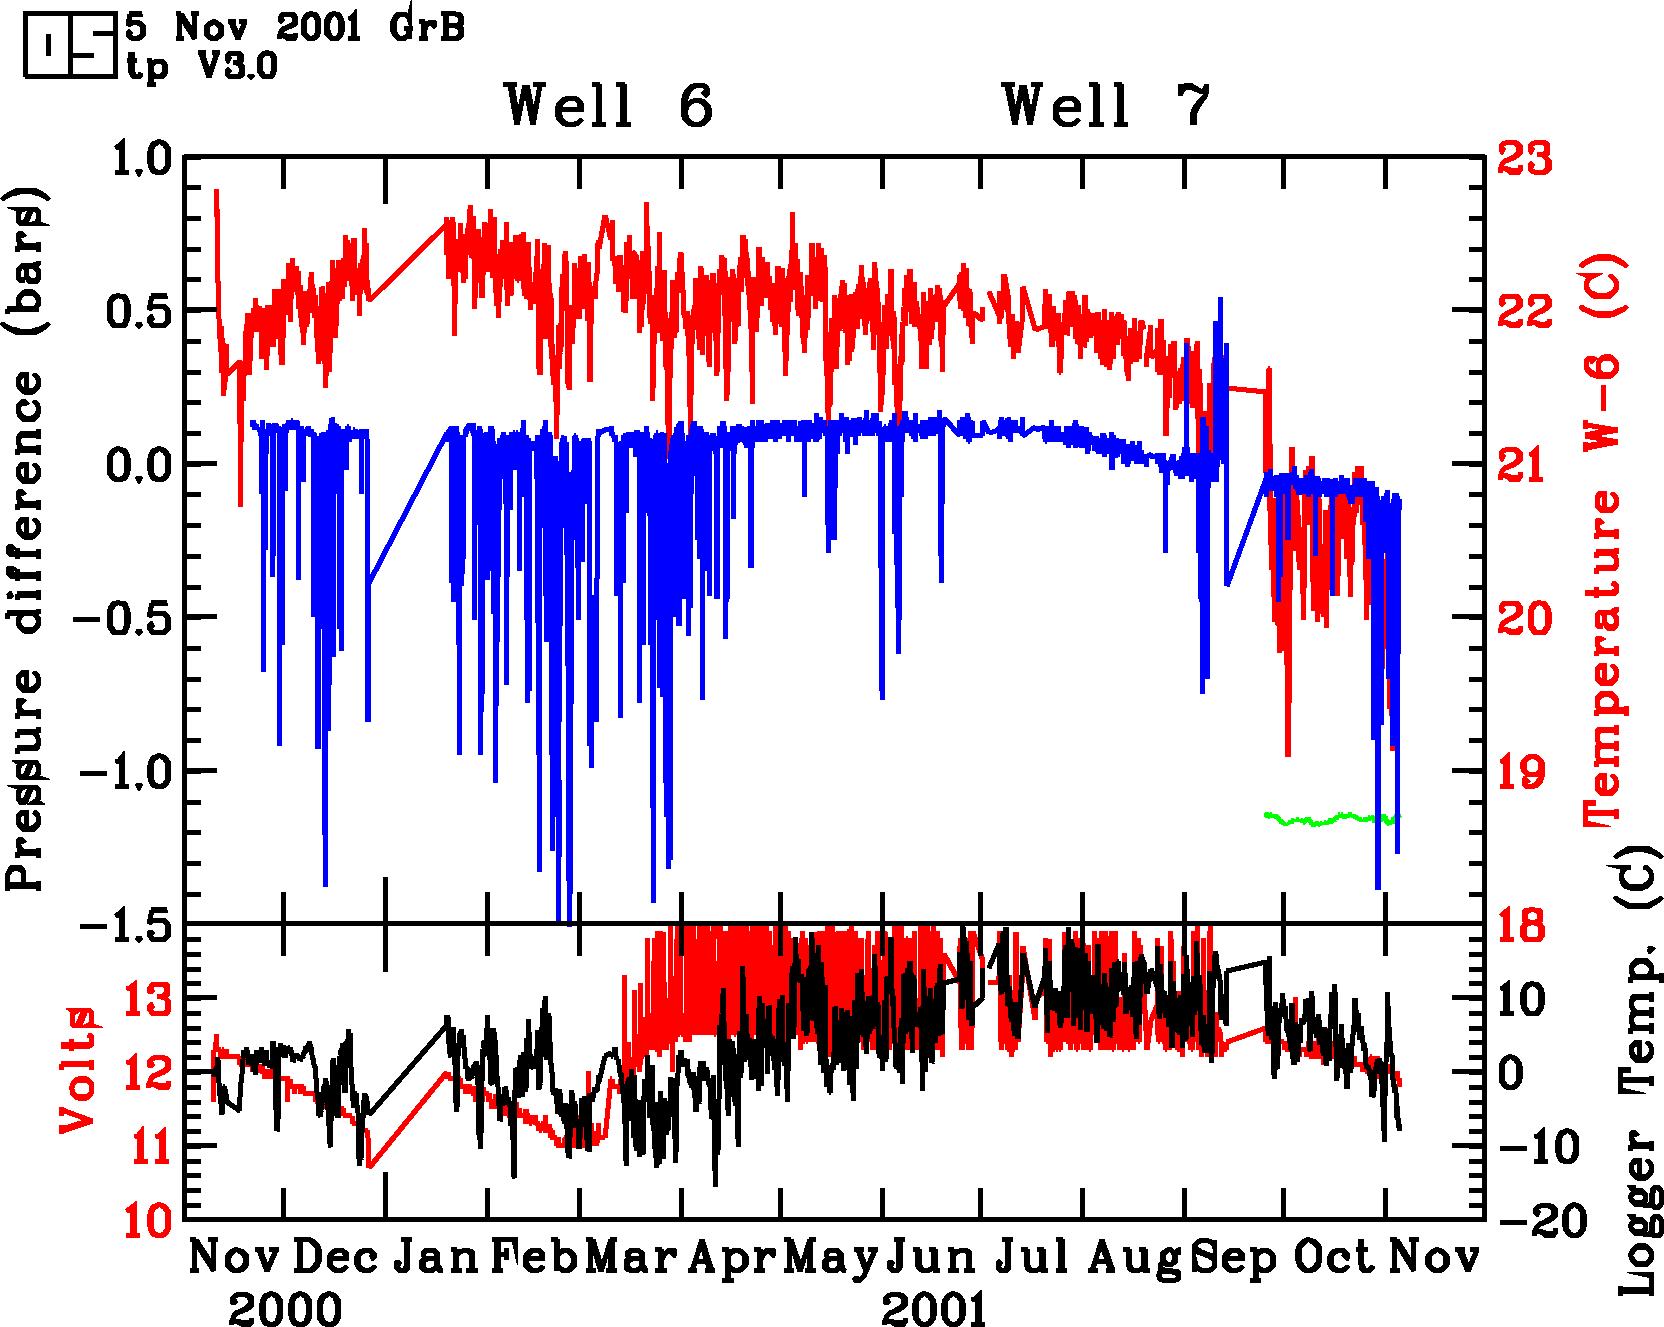
Figure 6: Observed pressure history of well 7 (blue), and pressure (green) and temperature (red) of well 6, for the hydrological station S-10 at Storu-Tjarnir, during November 2000 to November 2001.
Pressure data from station S-11 in Husavik is presented on Figure 7. This well had the same pressure sensor problem as well 6 at Storu-Tjarnir, namely that the pressure transducer became non-functional after only a few weeks of operation. The pressure sensor was replaced in June 2001 with an absolute transducer, immersed to a depth of 40 m. This well responds to the seismic event near Grimsey in mid August 2001, to be discussed in a later chapter.
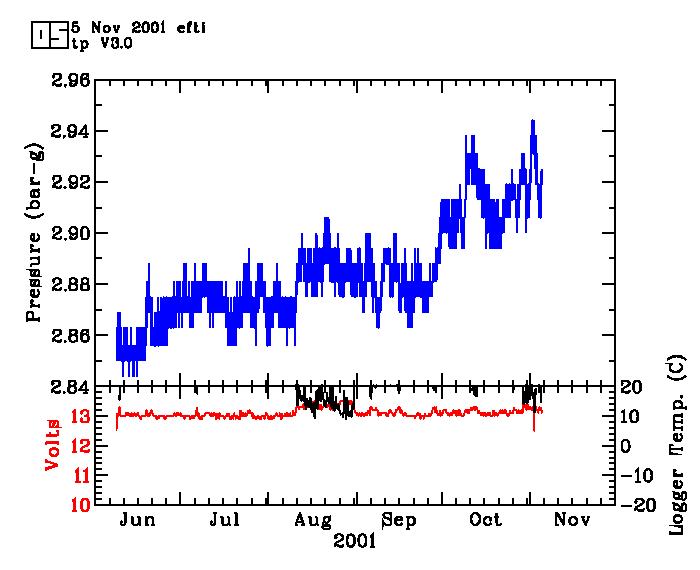
Figure 7: Observed pressure history of well4 at station S-11 in Husavik,
during June to November 2001.
This station began operation in early October, after being transferred from Árnes. The well is on the shore and some 10 km to the north of Husavik. This station is the only one currently located to the north of the Husavik-Flatey fault zone. Figure 8 shows the recorded pressure history. Tidal fluctuations are dominant in the pressure signal here, where a high-pressure spike on October 8 may be the only exemption. Note that the pressure signal appears also be influenced by wind and waves, resulting in “noisy” pressure occasionally. Similar feature is observed in Flatey. The pressure data from S-12 will be discussed in the next chapter.
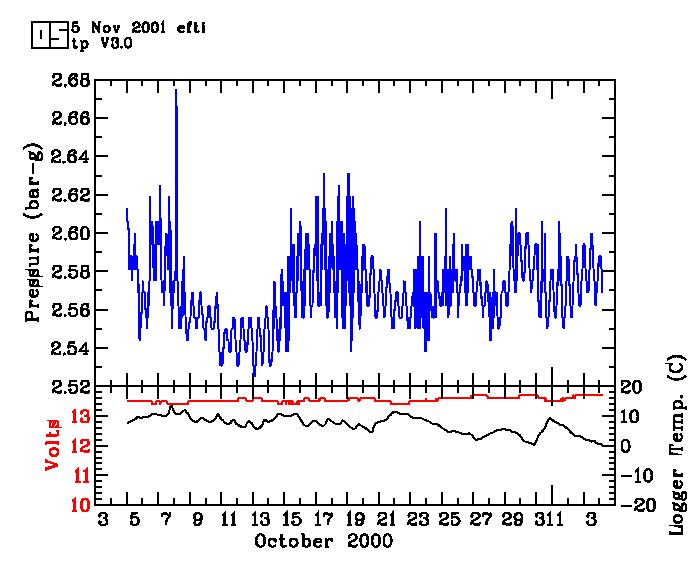
Figure 8: Observed pressure history (blue) at station S-12 in Tjörneshöfn, during October to November 2001. Note that the year is 2001, not 2000 as shown by the x-axis label.
Figure 9 shows, in the same graph, the pressure histories of stations S-8 and S-11, recorded during August 2001. This time period coincides with seismic activity near Grimsey (Figure 3). What is of interest here is that the Husavik station also measures this tectonic event. The shape of the pressure change is, however, opposite, i.e. pressure is increased in Husavik but decreased in Flatey. A high-pressure spike may actually precede the Flatey pressure pulse, while later on in the event, a dilatation takes place under Flatey and the groundwater pressure is consequently reduced.
Figure 10 shows hydrological data collected during an event, possibly to be correlated with seismic activity in Öxarfjördur in late October (Figure 4). Of striking interest is the almost identical but inverse pressure history of wells connected to stations S-10 and S-11. Both wells are equipped with absolute pressure gauges while the well at station S-10 is artesian but S-11 is static. This means that the pressure fluctuations in station S-10 are proportional to barometric changes and may be of use when it comes to correct the pressure values for barometric changes in static wells. The longer period pressure fluctuations in Husavik appear thus only to be due to barometric changes. This may imply that the October 27-29 pressure event is only observed in Flatey.
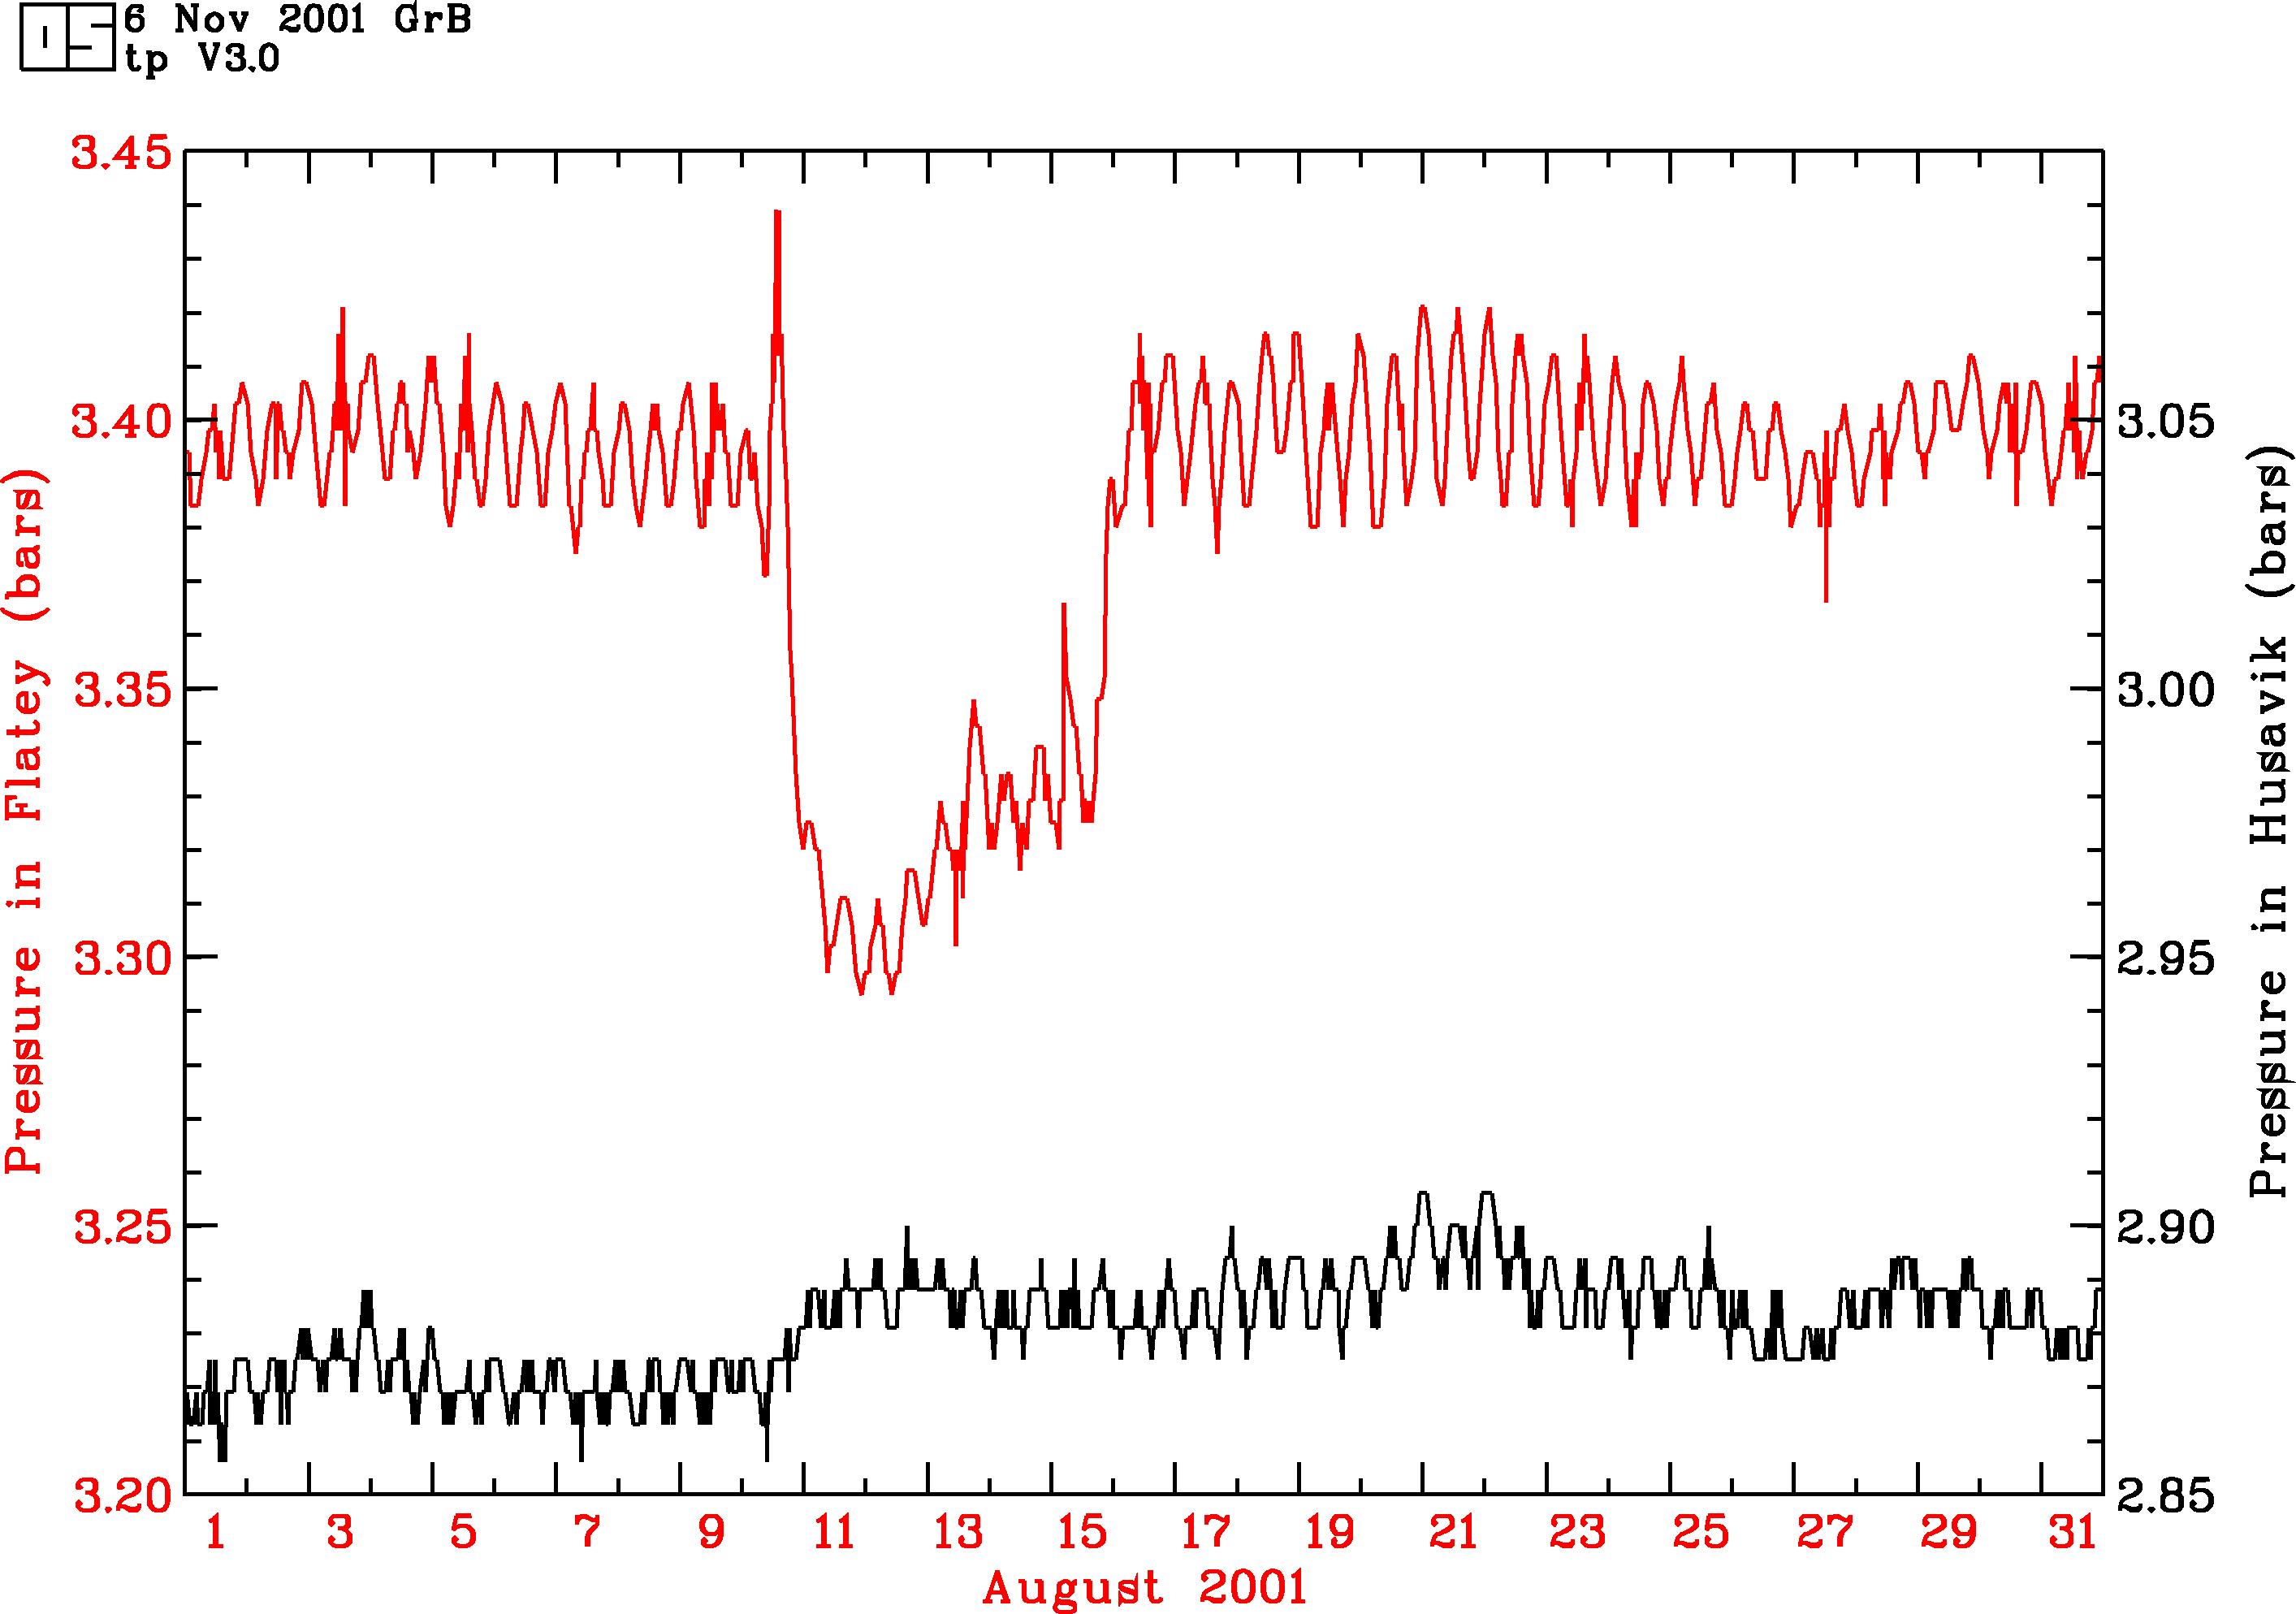
Figure 9: Observed pressure histories of station S-8 in Flatey (red) and
station S-11 in Husavik (black) in August 2001.
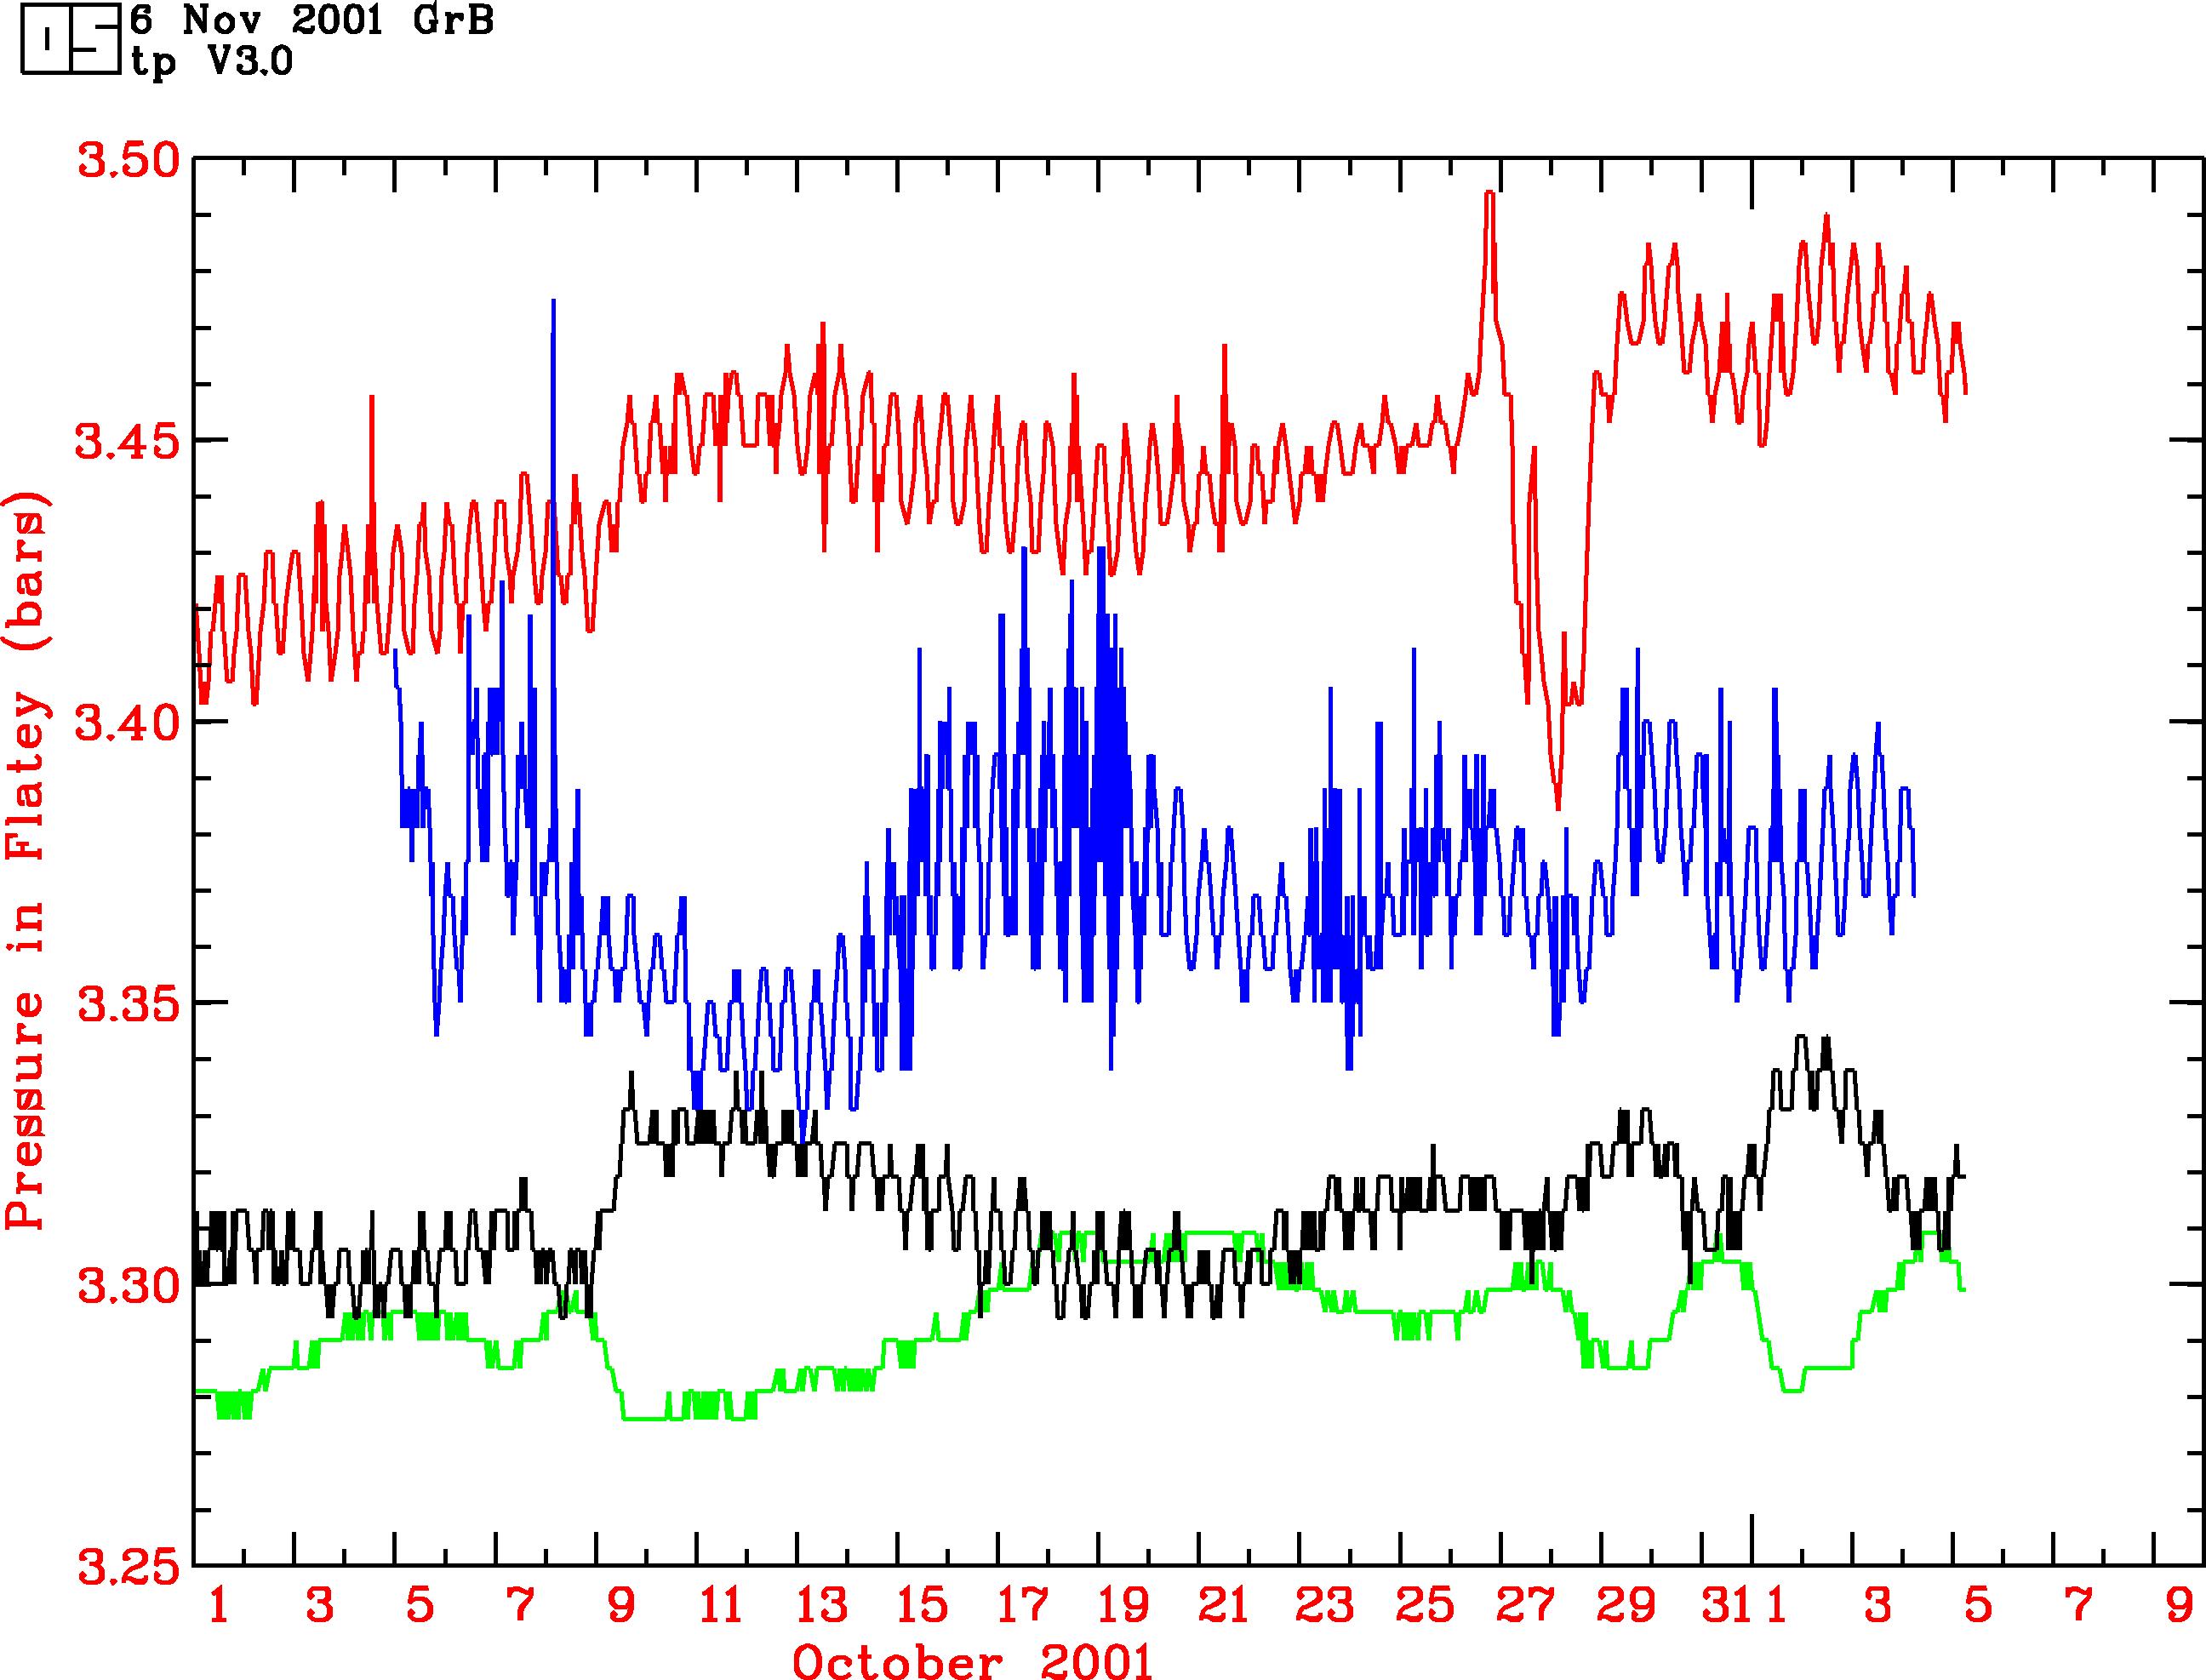
Figure 10: Observed pressure histories of station S-8 in Flatey (red), station S-12 in Tjörneshöfn (blue), station S-11 in Husavik (black) and finally station S-10 (well 6) at Storu- Tjarnir (green), in October-November 2001. All pressures are relative to y-scale.
Figure 11 presents finally pressure and temperature data from all stations in the north in early September 2001. Of interest are high-pressure spikes observed in well 7 at Storu-Tjarnir (orange curve on the figure). These may be taken as real data but another explanation is more likely, namely that cows and sheep are chewing the cable between the logger and the well. This causes temporarily a short circuit in the cable and an exponential decay as the moisture from the bite dries off. The drastic fluctuation, taking place in the blue curve on September 10, confirms this. As a matter of fact, the sensor current consumption exceeded the tolerance of the data logger, resulting in a “black-out” period.
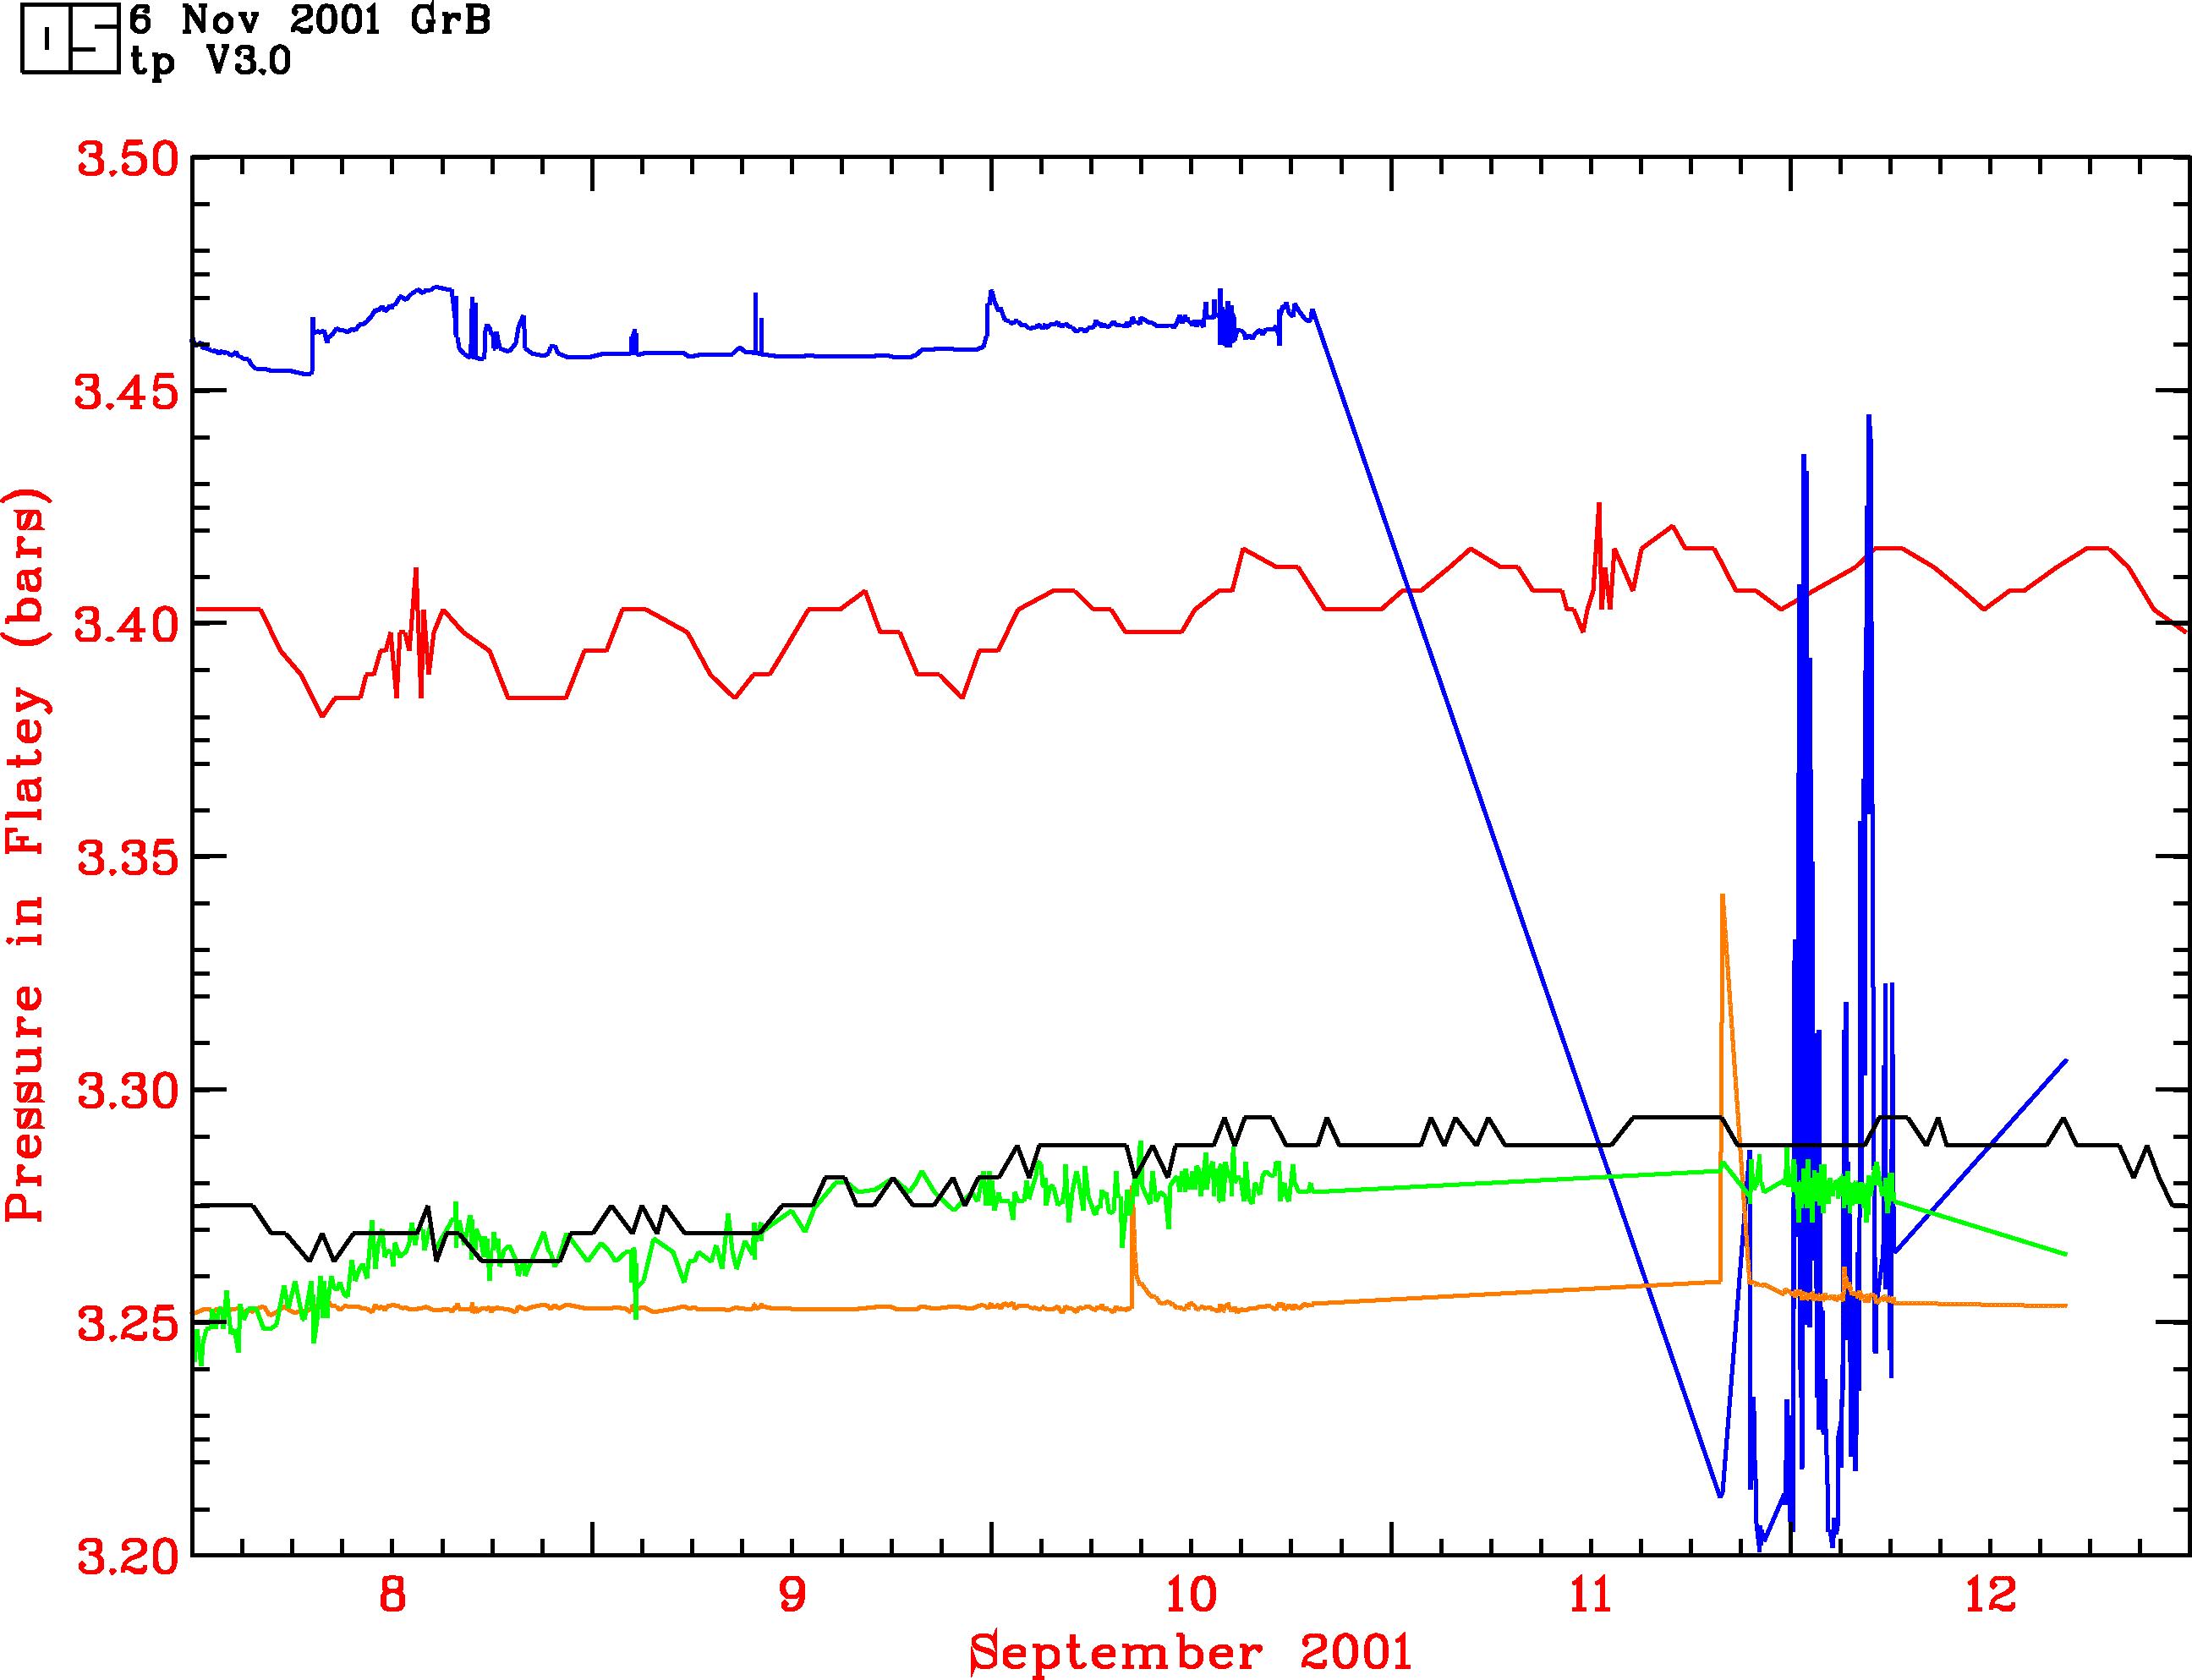
Figure 11: Observed pressure histories of stations S-8 in Flatey (red), station S-10 (well 6) at Storu-Tjarnir (blue), discharge temperature of well 6 at Storu-Tjarnir (green), welhead pressure of well 7 at Storu-Tjarnir (orange) and well pressure of station S-11 in Husavik.
The y-axis scale is relative.
The main conclusions drawn from the 1-year operation of a hydrological monitoring system in N-Iceland can be summarized as follows:
The system is operational and has a data recovery factor of 80-100 %.
Status of the hydrological stations is updated daily and can be accessed via the web page: www.os.is/ros/eftirlit
During the first year a few problems and failures have arisen. Some are associated with poor pressure sensor performance, one station didn’t enjoy enough sunlight to survive mid winter darkness, cables in Árnes were vandalized by the locals and in Storu-Tjarnir cows and sheep ate our on-ground cables.
Of the five sites monitored, it appears that the Flatey station is most sensitive to tectonic activity nearby, the Husavik station is less sensitive and Storu-Tjarnir and Árnes the least.
Seismic events near Grimsey in August 2001, and in Öxarfjördur in October 2001, are picked up as hydraulic pressure changes in Flatey and Husavik.
A correction to tidal and barometric changes still has to be carried out for most of the pressure data.
Orkustofnun, November 6, 2001
Grimur Bjornsson and Arnar Hjartarson