Physics Department |
 |
| Department - Earthquakes- GPS - Strain- Related links - Staff & e-mail - Co-workers and reports- Icelandic |
A Volcanic Eruption in Hekla, February 26, 2000
|
An eruption began in the Hekla volcano at approximately 18:17 on the 26th
of February, 2000. The timing of the eruption is based on a decrease
in strain build-up rate recorded in the Hekla volcanic vent by a strainmeter
located in a borehole about 15 km from the volcano summit. A
decrease in pressure occurs when the crust opens at the surface due to
magma pressure. The first earthquakes or small tremors were recorded at
17:07 at an earthquake site south of Hekla which is operated by the Meteorological Office. Previously microearthquakes were recorded
at a site operated by the
Science Institute, University of Iceland, situated on the northwestern
slope of Hekla at approximately 16:55. At 17:20 Páll Einarsson at the
Science Institue notified the scientific community of movements
in the vicinity of Hekla which could signal the beginning of an
eruption. At the Meteorological Office tremor was recorded at the
nearest station at approx. 17:20. Fairly well located earthquakes of
magnitudes 1-2 were
recorded at 17:30, 17:45, 18:17 and 18:26. They were located one to two
km southeast of the Hekla summit at a depth of a few km (not
well constrained). I arrived at the Meteorological Office at 17:30 and
notified the National Civil Defense of Iceland at 17:38 that the probability
of an eruption in Hekla was high. I then contacted the Civil Aviation
Administration and notified them that an ash plume from Hekla could be
expected to extend to flight heights, i.e. 10 km. I also contacted the
Meteorological Office Forecast Bureau and asked them to calculate ahead of time
the expected direction that the ash cloud would follow and make radar images at
short time intervals. At 17:31 the
automatic alert system at the Meteorological Office gave out the highest
alert for the Hekla region. At 17:47 the strainmeter at Búrfell showed a
distinct variation, which could be interpreted to be due to magma
forcing its way to the surface. Past experience of
the Hekla eruption of 1991 meant that an eruption could be expected
within 20-30 minutes.
I notified the National Civil Defense, the Civil Aviation Administration and the meteorologists about this. The eruption then began at 18:17. The first reports
from eyewitnesses were made in the following minutes. The weather radar images
showed no sign of an ash plume until 18:20, but a plume at this site has to
reach a height of 2 km before it is detected by the radar. On the next radar
image at 18:25 the plume had reached a height of 11 km.
February 27, 2000 |
Strain measurements |
|
The Meteorological Office operates a volumetric strainmeter network in southern Iceland. Strain changes were observed at these stations in association with the Hekla eruption on February 26. These strainmeters, coupled to borehole walls, detect variations in bedrock volume. Map 1 shows the location of the strainmeter network. The network has been in operation since 1979 in conjunction with the Carnegie Institution of Washington. Figure 1 shows the strainmeter data from Feb. 26 to March 1. Figure 2 shows part of the records in greater detail. The strainmeter at Burfell shows continuous contraction in the bedrock from 17:45 to 19:20. At the same time other strainmeters show extension or an increase in bedrock volume. Figure 3 shows the strain rate at stations Búrfell and Skálholt. The Búrfell strainmeter shows that the contraction rate increases rapidly to 18:17, and then decreases. After 19:20 an increase in volume is observed (Figure 1 ). It is assumed that this change in the rate of opening marks the time that the conduit reaches the surface, i.e. the start of the "visual" eruption at 18:17. The strainmeter at Skálholt does not show a significant change. It is at a distance of 45 km from the volcano whereas Búrfell is at a distance of 15 km. From the results of the strain measurements we can define three phases in the eruption in the first 24 hours. Firstly, the opening of the conduit to the surface from 17:45 to 18:17. Secondly, the continuing but much slower expansion of the conduit to 19:20. And finally, after the conduit is fully developed, all stations show an increase in volume when magma flows from the magma chamber under the volcano. In the first two phases there is also some kind of emptying, but the opening has the most influence on the strainmeters. The reason that the polarity varies between stations in the first and second phases is that the conduit is an approx. 7 km long intrusion. In a direction perpendicular to the intrusion, where the station Búrfell is situated, we observe contraction. However, in wide areas parallel to the intrusion, out from its ends, we observe extension. All the other stations are in those areas and Geldingaá is to the north. The strain changes we observed are similar to those of the Hekla eruption in January 1991. First observations however show the signal at Búrfell to be smaller now, but the other stations show similar or larger signals. We have yet to find an explanation for these differences. A slightly different direction and location of the fissure in this eruption compared to the 1991 eruption could possibly explain this difference. Right before midnight on Feb. 27 extension stops at Búrfell which could indicate that the lava flow decreases.
February 28, 2000 |
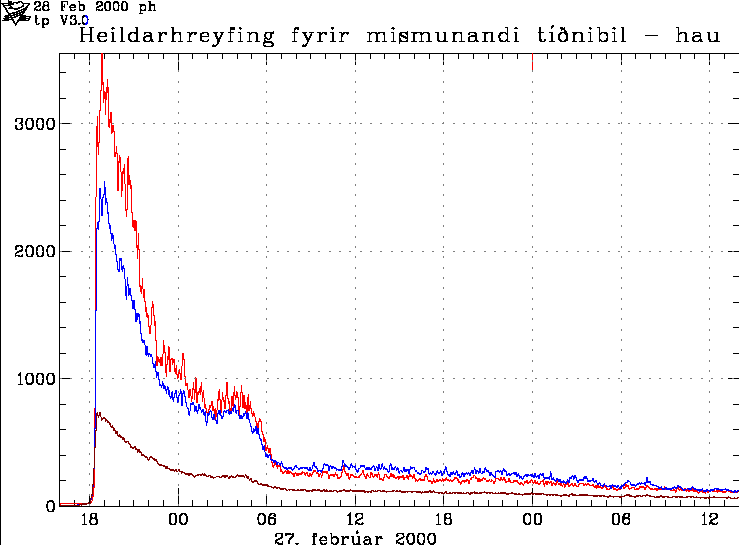
Tremor recorded at Haukadalur 10 km west of Hekla

Red is 0.5 - 1 Hz, blue 1 - 2 Hz, brown 2 - 4 Hz. Feb. 26.-28. 2000
The figure shows tremor recorded at Haukadalur. At the beginning of the eruption, at approx. 18:17, Feb. 26, the tremor increases rapidly and reaches a maximum at 18:50. It then decreases till about 7:00, Feb. 27. Afterwards it is steady. The tremor is now approximately one-tenth of the maximum. On the other hand it is over 10 times as great as is normal. Therefore the eruption is plainly still in progress. February 28, 2000
|
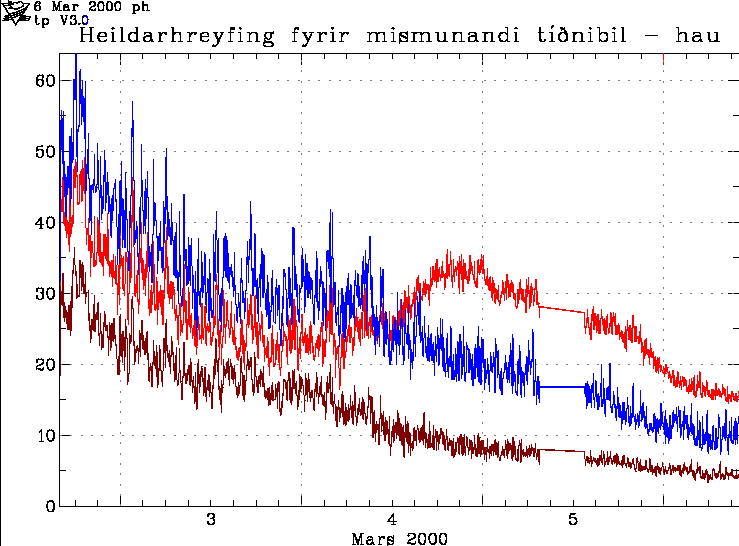
Tremor recorded at Haukadalur 10 km west of Hekla

Red is 0.5 - 1 Hz, blue 1 - 2 Hz, brown 2 - 4 Hz.
The figure shows the same development between 21:00, March 2 and 09:00, March 6, on a different scale. Páll Halldórsson |
Tremor recorded at Haukadalur March 2