Intsallation and operation of the SMSITES seismic stations BRE, FLA and HED as well as the SMSITES hydrological network was described in the June 2001 SMSITES monthly report and in the November 2001 SMSSITES Report. Basic information about location of the monitoring stations is found in the first year SMSITES report. This report will describe more generally the conditions of the stations as well as the data retrieved and basic evaluations in the year 2002.
Figure 2 shows cumulative strain release and cumulative number of earthquakes in TFZ during 2002. Earthquake swarm occured on the Husavik-Flatey Fault (close to Gjögurta) late in March 2002. The biggest earthquake in that swarm was 2.8 in magnitude. In May swarm activity took place east of Grimsey island. In mid July earthquake swarms were detected in the northern part of the TFZ, about 40 km NW of Grimsey Island. On September 16th at 18:48 hour an Mb=5.5 (NEIC) earthquake occured in the northern part of the TFZ about 50 km NW of Grimsey island. Several hundreds of earthquakes followed in that region.
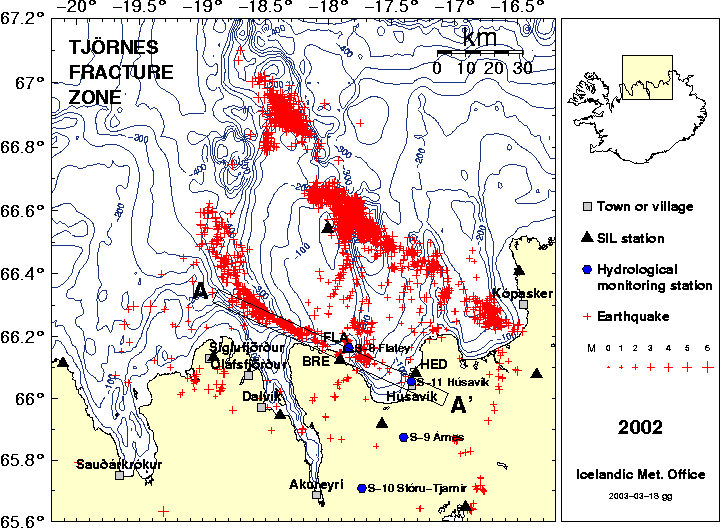
Figure 1: The map shows erathquake epicenters (red crosses) during the year 2002. SIL seismic stations are shown with black triangles and hydrological monitoring stations are shown with blue circles. The box AA' represents here the Husavik-Flatey fault. The box AA' is 90 km long and 5 km in width
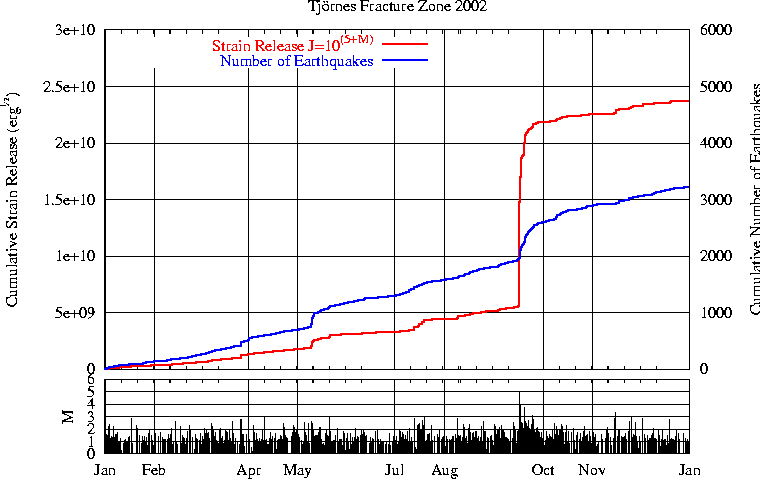
Figure 2: The upper part of the figure shows Cumulative Strain Release (red line) and Cumulative Number of Earthquakes (blue line) for the TFZ in 2002. The lower part of the figure shows magnitudes versus time for earthquakes in TFZ during the year 2002.
Location and uptimes of the stations BRE, FLA and HED is shown in table 1, table 2 and figure 3.
We define downtime here when the ASP driver does not write a time information into a time.log file for more than 5 minutes. The stations FLA and BRE had some power failures in January and Februrary 2002. A computer disk crash occured at HED in December 2002 and it was replaced in January 2003.
| Station | Latitude | Longitude | Elevation | Name |
| BRE | 66.12338° | -17.90967° | 56 m | Brettingsstaðir |
| FLA | 66.16067° | -17.84750° | 25 m | Flatey |
| HED | 66.08100° | -17.31000° | 80 m | Héðinshöfði |
| Station | Jan | Feb | Mar | Apr | May | Jun | Jul | Aug | Sep | Oct | Nov | Dec | 2002 |
| BRE | 93.01% | 73.62% | 89.67% | 97.13% | 83.67% | 84.74% | 82.99% | 99.74% | 87.55% | 99.63% | 99.63% | 99.48% | 90.95% |
| FLA | 57.08% | 57.60% | 97.31% | 97.68% | 91.06% | 91.05% | 97.81% | 99.77% | 99.75% | 98.35% | 99.39% | 99.40% | 90.72% |
| HED | 100.00% | 100.00% | 100.00% | 99.37% | 100.00% | 100.00% | 99.04% | 97.76% | 99.93% | 84.00% | 60.42% | 52.35% | 91.01% |
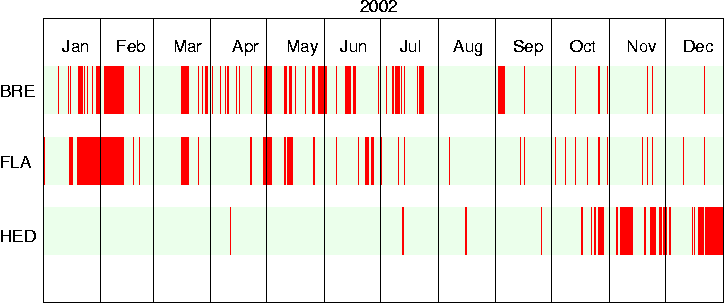
Figure 3: Uptimes/Downtimes for the SIL stations BRE, FLA and HED during 2002. Uptimes are in light green and downtimes in red.
The strip AA' shown in figure 1 represents the Husavik-Flatey fault used here in this report. The box AA' from NW to SE is 90 km long and 5 km in width.
The seismicity is described in figures 4-6. The seismic rate is constant and at conventional sites except for a swarm in September 2001, 5-15 km north of Siglufjordur (close to A). As seen in figure 6 the activity concentrates on three swarm localities with some tendency to be distributed perpendicular to the direction of the main fault.
.
Figure 4: Cumulative number of earthquakes versus time
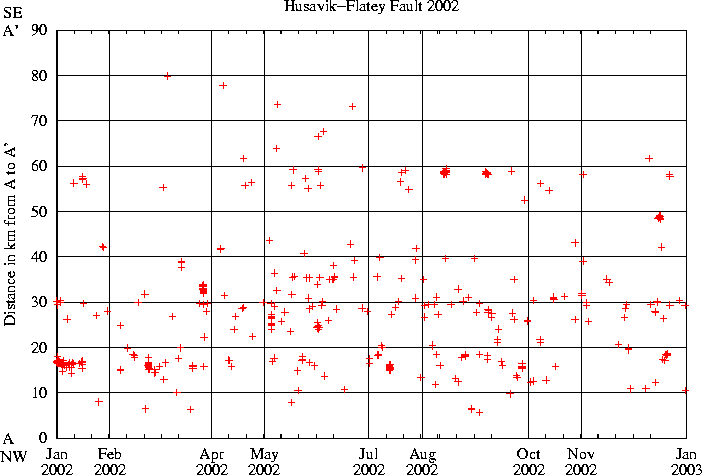
Figure 5: Earthquakes along the Husavik-Flatey fault versus time.
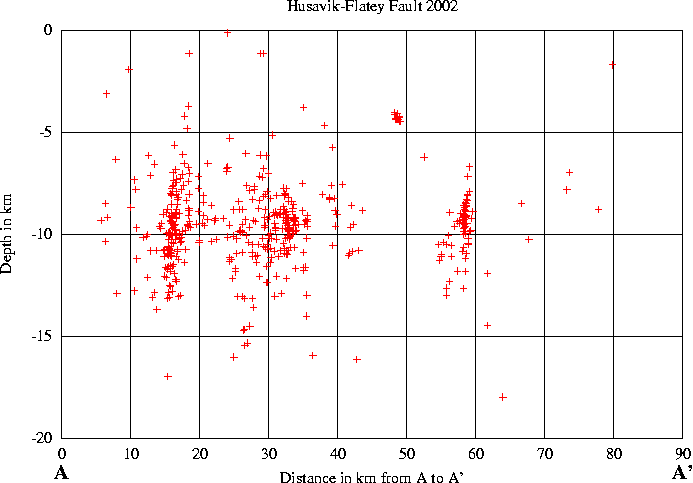
Figure 6: Earthquakes depths versus distance along AA' i.e. along the Husavik-Flatey fault.
Textinn her a eftir er fra þvi 2001 um Öxarfjardarhrinuna
A swarm started in this area soon after mid September as seen in figure 1. The activity was located at various depths within an area of around 2 km diameter to start with, but with main center of activity moving 2-3 towards SW at a later stage. A work is starting to analyse this swarm in detail, based on refined relative locations as well as comparison with earlier swarms in this area. This spot has frequently shown swarm activity, but the present activity is the most intense since 1994, i.e. since detailed and accurate enough information became awailable to draw such a conclusion.
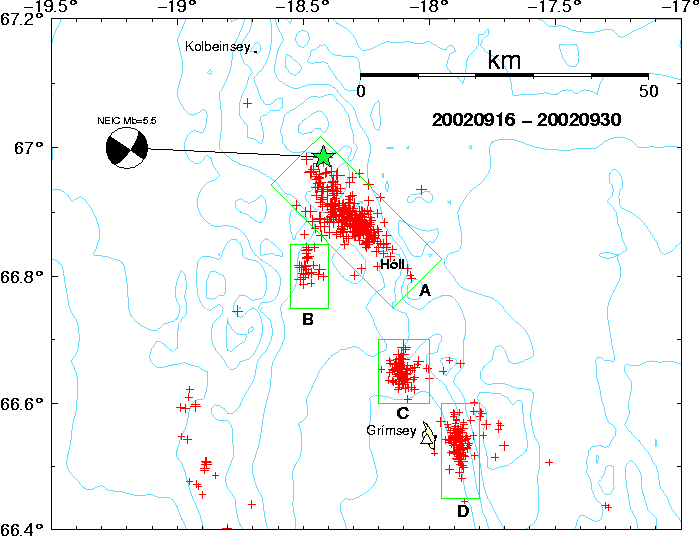
Figure 7: The crosses represent earthquakes in Öxarfjördur during January-October 2001. The green crosses are earthquakes with magnitude greater than or equal to 3 and the red ones are less than 3 in magnitude.
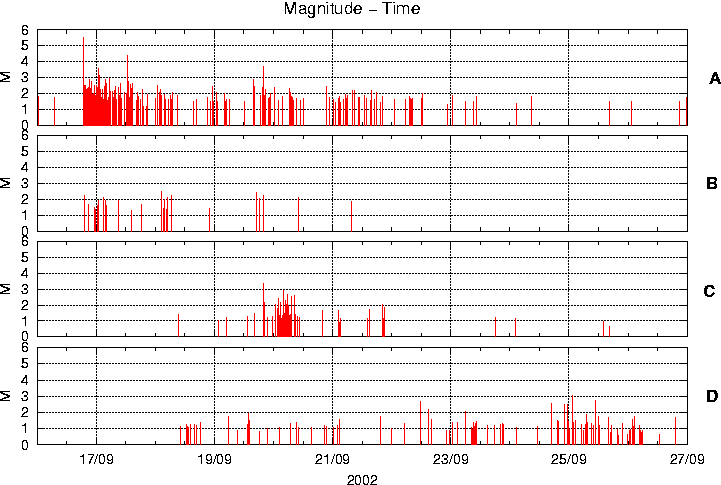
Figure 8: Magnitude versus time.

