


Next: Task 3: Developing routine
Up: Subproject 3: Monitoring stress
Previous: Task 1: Identify optimal
Start: March 1997 (month 13)
End: February 1998 (month 24)
Responsible partner: UEDIN.DGG
Cooperative partner: IMOR.DG
Time-delays and polarizations have been measured for all suitable data
in the period January 1996 - May 1997, inclusive. Suitable events are
those recorded with station-to-epicenter distance less than hypocentral
depth. These are within the shear-wave window which ensures that the
shear-waves are not distorted by surface conversions. This constraint
places a severe restriction on the number of events that can be used for
shear-wave splitting analysis. Also, to identify temporal trends, there
needs to be sufficient activity, spread in time, near the station.
These criteria were only fulfilled at stations SAU and BJA.
Time-delay measurements are analyzed for temporal trends in Figures 18
and 19. At each station, the mean circular polarization direction is
Figure:
Shear-wave splitting at SAU from January 1, 1996 to
June 1, 1997. Variation of normalized time-delays with time, and polar
equal-area maps out to 45 of shear-wave polarizations with dotted line
indicating average direction, for (a) ray paths in bands with incidence
0 to 15 to the crack face (sensitive to crack density), and for (b)
ray paths in bands with incidence 15 to 45 to the crack face
(sensitive to aspect ratio). Lines are linear least-square fits to data
before and after the Vatnajökull eruption (October 1996). Error bars
are approximate.
of shear-wave polarizations with dotted line
indicating average direction, for (a) ray paths in bands with incidence
0 to 15 to the crack face (sensitive to crack density), and for (b)
ray paths in bands with incidence 15 to 45 to the crack face
(sensitive to aspect ratio). Lines are linear least-square fits to data
before and after the Vatnajökull eruption (October 1996). Error bars
are approximate.
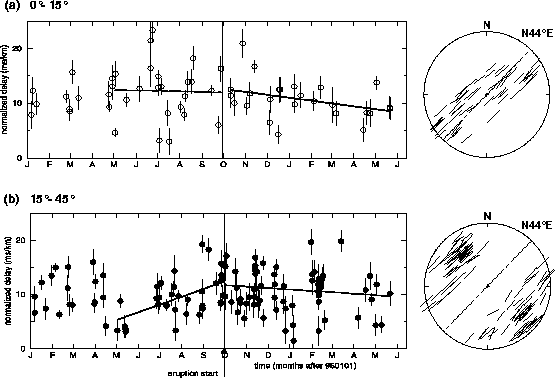 |
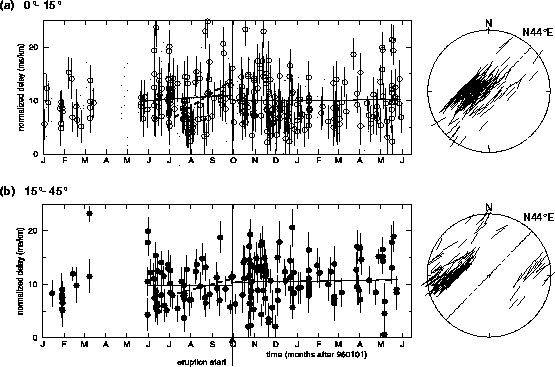
Figure 19:
Shear-wave splitting at BJA from January 1, 1996 to
June 1, 1997. Diagrams as for Figure 18. The dashed lines are linear
least-square fits for a shorter time period. The absence of data for
March, April and May 1996 is due to instrumental problems.
 |
calculated, and time-delay measurements with polarizations within the
standard deviation of this direction are selected (at SAU and BJA this
is polarizations N44E  20). The time-delay
measurements (normalized
over straight-line path distance) are then separated into two bands.
The bands are defined by incidence to the vertical plane of symmetry
parallel to the mean polarization direction (interpreted as the strike
of aligned near-vertical cracks), previous studies have shown that the
outer band of time-delays is expected to be the most sensitive to
changes in crack aspect-ratio, the result of increasing stresses. At
SAU, there is a clear increase in time-delays from about May 1996 to the
beginning of October 1996 in the outer band of measurements. After this
time, the delays gradually decrease. During the same period, the delays
in the inner band remain roughly constant. This suggests that the
change in delays could be a result of increasing aspect-ratio of the
microcracks with the stress build-up (and subsequent release). The
tectonic event likely to responsible for this is the Vatnajökull
eruption that started on September 30, 1996, the fourth largest
eruption in Iceland this century. The volcano is over 160 km away, so
the effect is also expected to be visible on other stations during this
period.
20). The time-delay
measurements (normalized
over straight-line path distance) are then separated into two bands.
The bands are defined by incidence to the vertical plane of symmetry
parallel to the mean polarization direction (interpreted as the strike
of aligned near-vertical cracks), previous studies have shown that the
outer band of time-delays is expected to be the most sensitive to
changes in crack aspect-ratio, the result of increasing stresses. At
SAU, there is a clear increase in time-delays from about May 1996 to the
beginning of October 1996 in the outer band of measurements. After this
time, the delays gradually decrease. During the same period, the delays
in the inner band remain roughly constant. This suggests that the
change in delays could be a result of increasing aspect-ratio of the
microcracks with the stress build-up (and subsequent release). The
tectonic event likely to responsible for this is the Vatnajökull
eruption that started on September 30, 1996, the fourth largest
eruption in Iceland this century. The volcano is over 160 km away, so
the effect is also expected to be visible on other stations during this
period.
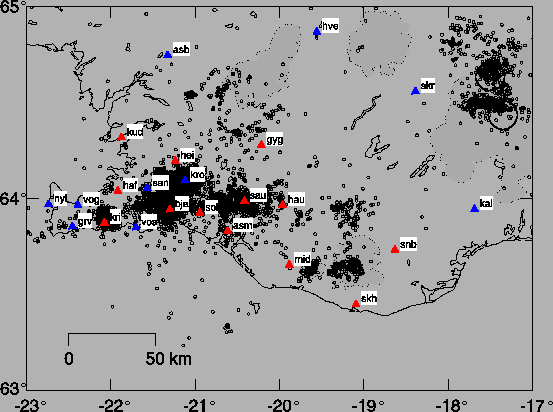
The only other station with sufficient data during this time period is
BJA. BJA is near the centre of the SISZ (Figure 20) and is in a much
Figure 20:
Map of SW-Iceland showing all seismicity recorded during the
period January 1996 - May 1997 (inclusive). Red triangles are SIL
stations that were deployed for the whole period, and blue triangles are
stations added to the network during this period. The large black
circles show the locations of the Bárdarbunga and Grímsvötn volcanoes
beneath the Vatnajökull ice sheet.
 |
more complicated tectonic area than SAU. The data does not show the
same trend as SAU over the period May to October 1996, but there is an
average increase in delays when a shorter time period is taken (mid-July
to October 1996). For this time period, there is an increase in the
delay measurements in both bands of data, suggesting there was also some
increase in crack density. This trend may be related to the changing
stress state prior to the eruption. However, there was also a magnitude
4.2 event, only 7 km from the BJA on October 14, 1996. It is
possible that this increase of delay times over the shorter period is
related to this more local event, rather than the eruption (200 km from
BJA).
Data from station KRI is also shown in Figure 21. The measurements at
this station have
Figure:
Normalized time-delays at
KRI from February 15, 1996 to March 15, 1997, as for Figure 18.
Lines are linear least-square fits before and after the magnitude 3.9
event, 7 km from KRI (no data recorded in the 0-15 band).
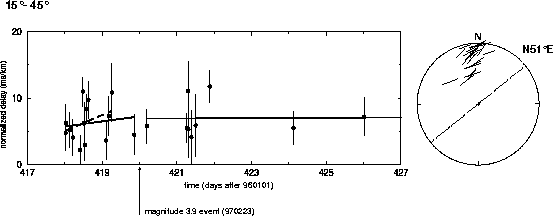 |
polarizations N51E
28.
In February 1997 there
was an increase in activity just north of the station which culminated
in a magnitude 3.9 event on February 23, 1997, 7 km from KRI. This
is the largest event in this area for at least two years. There is some
evidence
from the time-delay data in Figure 21 that there is an increase in delays
prior to this larger event. As can be seen from the projection, the
events all have similar locations, hence similar ray paths that make the
changes in delays all the more significant, as they are less subject to
variations caused by different ray paths.
Next: Task 3: Developing routine
Up: Subproject 3: Monitoring stress
Previous: Task 1: Identify optimal
Gunnar Gudmundsson
1999-03-17