Summary
PRENLAB is a two years multinational project of earthquake prediction
research, starting March 1, 1996. In this project multidisciplinary
European technology and science are applied in a common action aimed
at progress in earthquake prediction research and at reducing seismic
risk. The questions are ``where, when and how'' large earthquake ground
motions will occur. Answers are sought by studying the physical processes
and conditions leading to large earthquakes. Iceland, sometimes
called a Natural Geophysical Laboratory, is the test area for
the project. The epizodic character of crustal movements and high
seismicity, the well-defined earthquake zones and shallow sources, as
well as the extensive knowledge of the geology and geophysics
of Iceland, make it an excellent test area for earthquake prediction
research. Frequent short-term variations in strain rate can be
utilized as a time variable input to the experiment. Among other
significant facilities of this laboratory is the existence of a high
quality earthquake data acquisition and evaluation system. The partners
of the project come from various branches of geosciences
of 11 institutions in 6 European countries: France, Germany, Iceland,
Italy, Sweden and United Kingdom. PRENLAB-two, a continuation of
PRENLAB is planned to start a two years period March 1, 1998.
Key words
Mitigating risk, Hazard assessment, Multidisciplinary approach,
Geodynamic approach, Modelling earthquake processes, Microearthquake
technology, Earthquake precursors, Premonitory changes, Short term
warnings, Database.
Introduction
The classical hazard assessment as it has been applied in Iceland and more countries is based mainly on historical documentation and limited information from instrumental earthquake catalogues of this century and a general knowledge of where the earthquake generating plate boundaries are. Although such hazard assessment has been extremely useful in many aspects, it has the obvious limitation that it is only based on a few hundreds of years of history, and in fact assumes that we should only expect hazards that are comparable to those which have happened within this short history. Also it does not take into consideration the exact position of and the interaction of faults that are expected to move in earthquakes or earthquake sequences. It intergrates effects over large areas in time and space while it is well known that by far the largest destruction is related to the proximity of the faults which are activated in the earthquakes each time, and to the areas where the faults rupture the surface. Hazard assessment based mainly on catalogues of earthquakes and their magnitudes has come to the state that it cannot have more progress until a better modelling of the fault processes has been achieved, until we can recognize better the involved faults and monitor their movements and interaction and until we can monitor better the stresses in the adjacent area and learn more about the rheological propoerties and of the role of fluids in the crust.
For a progress in earthquake hazard assessment and in general for progress in earthquake prediction research we must aim at creating dynamic models which can explain multiplicity of observations, meaning that many disciplines of geosciences must be involved.
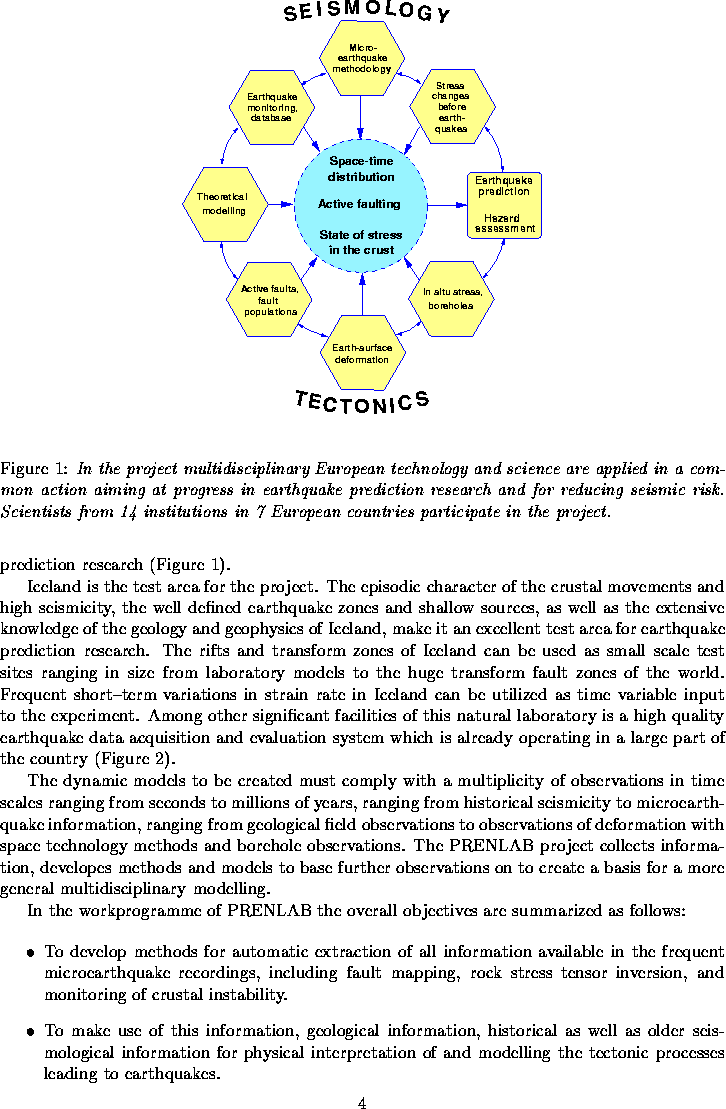
This is the basis of the PRENLAB project. It is a multidisciplinary approach
in earthquake prediction research (Figure 1).
 |
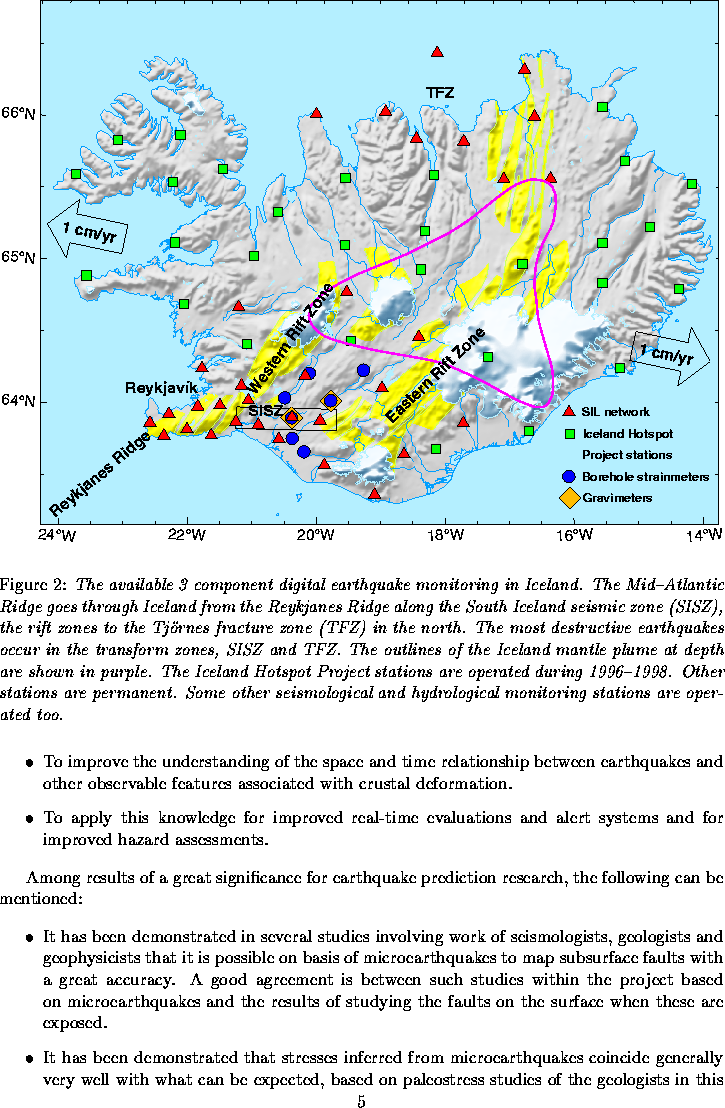
Iceland is the test area for the project. The episodic character of the crustal movements and high seismicity, the well defined earthquake zones and shallow sources, as well as the extensive knowledge of the geology and geophysics of Iceland, make it an excellent test area for earthquake prediction research. The rifts and transform zones of Iceland can be used as small scale test sites ranging in size from laboratory models to the huge transform fault zones of the world. Frequent short-term variations in strain rate in Iceland can be utilized as time variable input to the experiment. Among other significant facilities of this natural laboratory is a high quality earthquake data acquisition and evaluation system which is already operating in a large part of the country (Figure 2).
 |
The dynamic models to be created must comply with a multiplicity of observations in time scales ranging from seconds to millions of years, ranging from historical seismicity to microearthquake information, ranging from geological field observations to observations of deformation with space technology methods and borehole observations. The PRENLAB project collects information, developes methods and models to base further observations on to create a basis for a more general multidisciplinary modelling.
In the workprogramme of PRENLAB the overall objectives are summarized as follows:
Among results of a great significance for earthquake prediction research, the following can be mentioned:
In the following the methods and result of the PRENLAB project
will be described in more detail.
Methods and results
 Real-time evaluation of earthquake-related-processes and development of database
The work described here is basically a responsibility of the Icelandic
Meteorological Office, Department of Geophysics (IMOR.DG) in cooperation
with all the other groups involved in PRENLAB. In developing methods for
acquisition and evaluations there has been an especially close cooperation
with Uppsala University, Department of Geophysics (UUPP.DGEO).
Extension of the monitoring networks
A very significant achievement in the data collection is the increase of number of operating seismic stations in Iceland. Since the start of the PRENLAB project in March 1996, the number of permanent seismic stations, SIL stations, in operation has increased from 18 to 33. The new stations are funded by Icelandic communities, hydrothermal and hydroelectrical power companies, civil defence funds, a private tunnel-digging company, the Icelandic Research Council, and indirectly by research groups carrying out tomographic studies, which can make use of the powerful SIL acquisition system. The largest supporter of this build-up project of the SIL system is IMOR.DG, which besides contributions to the initial costs guarantees the operation cost of the system. These stations are as other permanent stations of the SIL network available for the PRENLAB project and of great significance for it.
From summer 1996 to summer 1998,
29 extra digital broad-band stations are operated continuously at remote
places not covered by the SIL system, mainly for collecting teleseismic
data. This is a part of the Iceland Hotspot project, lead by Gillian Foulger,
University of Durham.
Among other participants are Princeton University, with Jason Morgan
and Guust Nolet, and Bruce Julian of the U.S. Geological Survey, besides
IMOR.DG. The waveform
information from these stations will be included into the SIL evaluation processes,
especially as concerns the local seismic activity. This is a very significant
addition to the data that we according to the original plan can approach for
the PRENLAB project. As these temporal stations are operated in areas where
we have only few SIL stations they can provide us with a complementary
overview about the stress conditions in the
country as a whole. Figure 2
shows the locations of the seismic stations operated in Iceland during the later part of the PRENLAB project.
Acquisition, evaluation and storing of data
A refined and easily accessible database for seismic data, mainly based on microearthquakes acquired by the SIL system is under construction. Since 1991, 90.000 earthquakes have been recorded by the SIL system. The data were automatically evaluated and manually corrected.
Facilities have been developed to store all the data on-line on hard disks. Seismogram data is stored using packed binary format, where only the number of bits that is required to store sample to sample variation, is stored.
Other data is stored in relational database tables. Station parameters such as coordinates, instrument characteristics and time corrections are stored in separate tables. This information is incorporated into headers when data are extracted from the database.
In order to insure against loss of data, procedures and facilities have been developed to back up all data onto magnetic tapes. All new data and modifications are written to tape each day and all data are written to tape approximately every two weeks. Periodically, a set of tapes is moved for storage to a different site. As magnetic tapes only last a few years, and the long-term stabilty of optical storage media is not well established, this is possibly the most effective way to permanently preserve the data, and it has the advantage that the data is always readily accessible.
An interface to the database through the World Wide Web is under development. Currently anyone with access to the Internet can search through a list of over 65.000 earthquakes that have been manually checked since January 1, 1995.
Work has been carried out for a new, reevaluated and refined catalogue of instrumentally measured earthquakes in Iceland since 1926. The catalogue from 1926-1963 has been reevaluated and put on digital form. The refinement of the more recent catalogues is in progress.
Spatial changes in seismicity have been studied in an area along the Reykjanes Peninsula, the South Iceland Lowland and into the eastern volcanic zone.
Work has been carried out for refined estimation of magnitudes and locations of historical earthquakes as well as felt events, not instrumentally detected since 1926.
Much work has been carried out in interpreting data from volumetric borehole strainmeters, which has lead to very significant results. Premonitory and coseismic changes, volumetric strain, and foreshocks of the magnitude 5.8 earthquake at Vatnafjöll, near the eastern end of the South Iceland seismic zone, have been studied. These can be interpreted and have been modelled as magmatic fluids intrusion coinciding with the foreshocks and the main shock.
A long-term overview (since 1979) of 7 volumetric strainmeters in the SISZ (Figure 2) has been worked out. Methods have been developed for correcting the strainmeter record of weather influences. As a result of this work can be mentioned a change in strain-rate 5-6 months before the start of the 1996 eruption in Vatnajökull, which may be caused by magma intrusion there, i.e. more than 150 km from the strainmeter stations.
The seismicity of Katla volcano which is beneath the Mýrdalsjökull glacier has been studied. Eruptions in Katla pose a considerable danger because of enormous water- and mudflows which accompany the eruptions. It is one of the objectives of the SIL network and the attached alert system to help to warn for the the future eruptions.
The seismicity of the volcanic eruption in Vatnajökull was studied as concerns hypocenters and mechanism of the earthquakes which were linked to the eruption. Much effort was put in saving data on this remarkable eruption from the seismic networks, both earthquake data as well as data on volcanic tremor. Vatnajökull is directly above the Iceland mantle plume and changes of the plume activity greatly affect the seismicity along all of the plate boundary in Iceland, and is thus of a great significance for the PRENLAB objectives.
Although the SIL system is a seismic data acquisition system, that is primarily designed for automatic acquisition and evaluation of data from local microearthquakes, it can also be used for collecting teleseismic and regional data for deep structure studies. It broadens the scientific use of the network and has made it easier to extend the network to a large part of the plate boundary in Iceland. The SIL station software has now been modified allowing for selection of waveform data additionally at 20 and 4 samples per second. This makes it economically possible to save long-time periods of seismological data from the SIL stations. We have developed an automatic procedure to select and store teleseismic data in the SIL system based on USGS/NEIC information on teleseismic events in the whole world which are measurable in Iceland. From USGS/NEIC we receive E-mail messages with a single-line information on earthquakes they have determined, the so-called ``E'' type messages. A selection program reads the messages and selects events that fulfill certain criteria of magnitude and epicentral distance. The program uses the iaspei91 model to compute the first arrival time at each station. The teleseismic body wave data are fetched with a sampling rate of 20 samples (in some cases 100 samples) per second and the surface wave data with sampling rate of 4 samples per second from the 1-3 days long ringbuffer of the SIL site stations. Since mid year 1996 waveform data from 230 teleseismic events have been stored by this automatic procedure.
Work has been carried out for studying and refining the alert thresholds for the SIL related alert system in Iceland. An alert detector monitoring large amplitudes and background noise (tremor) in both the unfiltered and the filtered bands of the seismic waveform data is operated on all the SIL stations. It has been tuned for 1 Hz sensors. The SIL system operates according to need with 1 second, 5 seconds and broadband sensors.
A real-time filter has been introduced into the on-line process of the SIL system, to be tuned for detecting harmonic tremor and signals that cannot be identified automatically. The continuous seismic signal at the SIL site stations is bandpass filtered at 0.5-1 Hz, 1-2 Hz and 2-4 Hz and the 1 minute mean amplitude is scanned and sent to the SIL center, where the interpretation of characteristics of the tremor is carried out and linked to the alert system. Visual presentation of this data gives a useful indication of the multiplicity of activity in real-time. This data has been calibrated and procedures developed to estimate magnitudes of local events larger than magnitude 2, independent of the waveform processing.
The extension of the SIL system into the highlands of Iceland has lead to
many problems in the automatic detection and analysis. The SIL system was
developed for use in the seismic zones. Monitoring in
the highlands reveals in many ways
new problems. Much work has been carried out to lower the detection
threshold for earthquakes in the volcanic Central Iceland. The new real-time
filter mentioned above is significant for this purpose as well as further
tuning of all detection parameters.
 |
To search for time and space patterns in the multiplicity of information in the SIL data
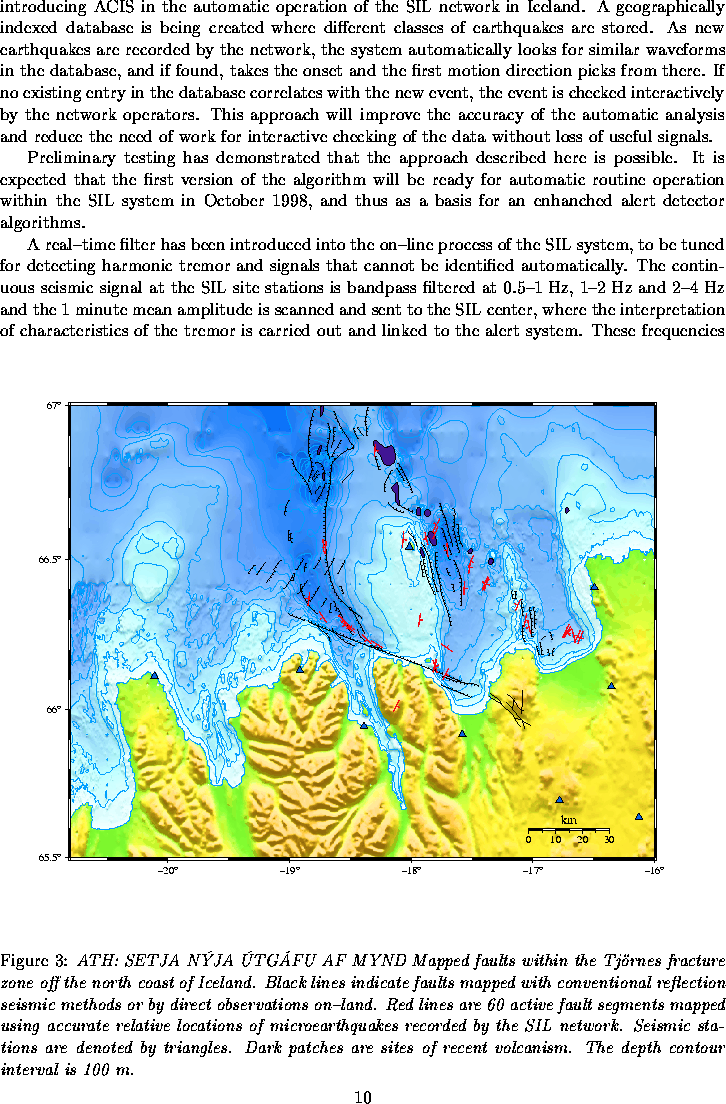
Results have been obtained in using seismological data for mapping active earthquake faults in the Tjörnes fracture zone at the north coast of Iceland (Figure 3). The method used is a multievent method based on cross-correlating similar signals at the the same seismic station. Provided the time accuracy of the seismic data of the SIL system, close to 1 millisecond, active faults can be mapped with accuracy of the order of 10 meters. Fault plane solutions based on spectral amplitudes of P and S waves are then used as a part of the mapping to reveal the sense of the fault motion. Several special fault mapping efforts have been carried out related to ongoing earthquake sequences in other parts of the country, so gradually information on fault arrangement in different parts along the plate boundary is being collected.
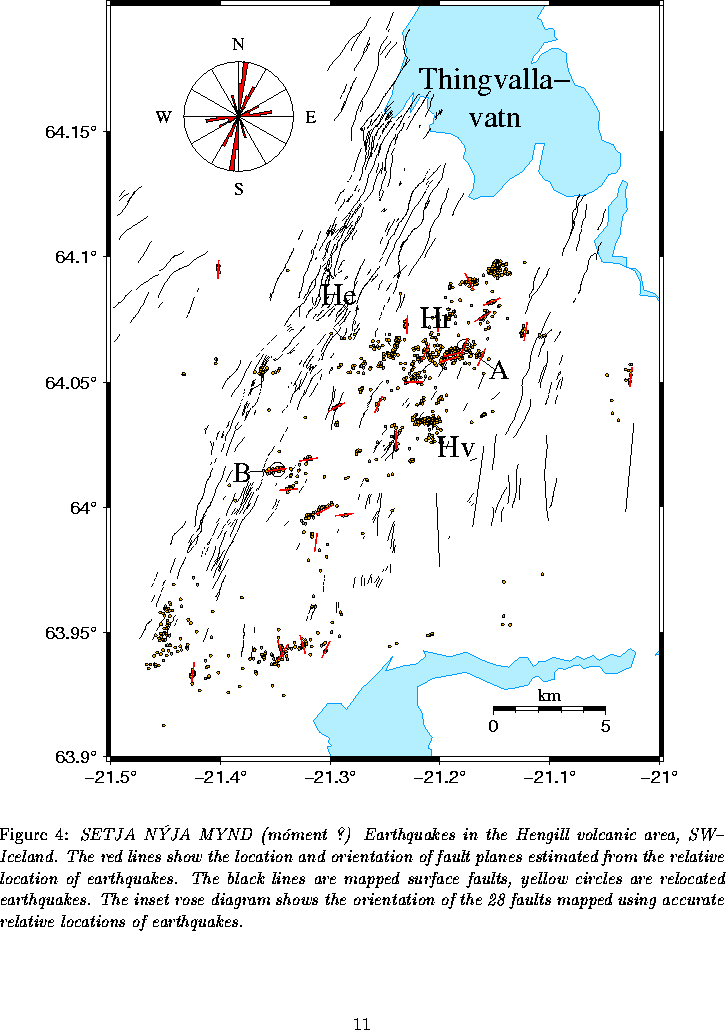
Results have been obtained on basis of investigation of recent high seismic
activity near the Hengill
triple junction in SW-Iceland, spatial and temporal varations of activity
have been studied and migration within the area. Fault plane solutions of
more than 20.000 earthquakes have been studied in the area
(Figure 4).
Work has been carried out on recent high seismic activity near the Hengill
triple junction in SW-Iceland, i.e. spatial and temporal varations of activity
have been studied and migration within the area. Fault plane solutions of
more than 20.000 earthquakes have been studied in the area.
 |
Introduction of new algorithms into the alert system and other evaluations of the SIL system
The basic option of the SIL seismic system techniques is to use microearthquakes to bring to the surface information from the source areas of earthquakes. Based on detailed microearthquake analysis it is possible to monitor active faults and movements across these, as well as stresses and stress changes in their surroundings. The smaller the earthquakes are which can be used the closer we are to continuous monitoring of such features, and the more detailed information we obtain of the spatial conditions. Therefore it is so significant to be able to obtain automatically as detailed and secure information as possible.
Work is going on for introducing ACIS into the automatic procedures of the SIL system. ACIS is an acronym for ``Reducing manual checking by Automatic Correlation of Incoming Signals''. As has been shown in the work on multievent analysis for detailed mapping of faults most seismic events correlate well with each other within some areas. Work is going on for testing and introducing ACIS in the automatic operation of the SIL network in Iceland. A geographically indexed database is being created where different classes of earthquakes are stored. As new earthquakes are recorded by the network, the system automatically looks for similar waveforms in the database, and if found, takes the onset and the first motion direction picks from there. If no existing entry in the database correlates with the new event, the event is checked interactively by the network operators. This approach will improve the accuracy of the automatic analysis and reduce the need of work for interactive checking of the data without loss of useful signals.
Preliminary testing has demonstrated that the approach described here is possible. It is expected that the first version of the algorithm will be ready for automatic routine operation within the SIL system in October 1998, and thus as a basis for an enhanched alert detector algorithms.
A real-time filter has been introduced into the on-line process of
the SIL system, to be tuned for detecting harmonic tremor and signals that cannot
be identified automatically. The continuous seismic signal at the SIL site stations
is bandpass filtered
at 0.5-1 Hz, 1-2 Hz and 2-4 Hz and the 1 minute mean amplitude is scanned and
sent to the SIL center, where the interpretation of characteristics of the
tremor is carried out and linked to the alert system.
These frequencies show to be useful
in discriminating noise of different origin. The lower frequencies are typical for
harmonic volcanic tremor, while the highest frequency
seems to be expressing noise
created by very intensive activity of very small earthquakes, although these are not
discriminated as such. Such an activity is more typical in the approaching of an eruption
and may possibly be of significance in the introductionary phase of earthquakes. Much work
remains to be done to analyze the noise and how it is related to other activities of the
crustal forces. This noise monitoring is already now used to monitor volcanic acivity.
The experience will also be a good basis for designing a new detector in the SIL system
which will be aimed at detecting and automatically evaluating ``slow
earthquakes''
(meaning small earthquakes with corner frequencies of the order of 1 Hz)
which are often observed in Iceland.
Retrieving of data and other preparatory work for modelling destructive earthquakes
Work has started to retrieve seismic data and older models which have direct relevance for modelling ``where, when and how'' catastrophic earthquakes occur in three of the main seismic risk zones of Iceland. These are the SISZ, the TFZ and the seismic zone close to Reykjavík. Models based on older information from seismological, geological and geodetic information will be a significant input to the modelling work based on the new multidisciplinary approach of PRENLAB.
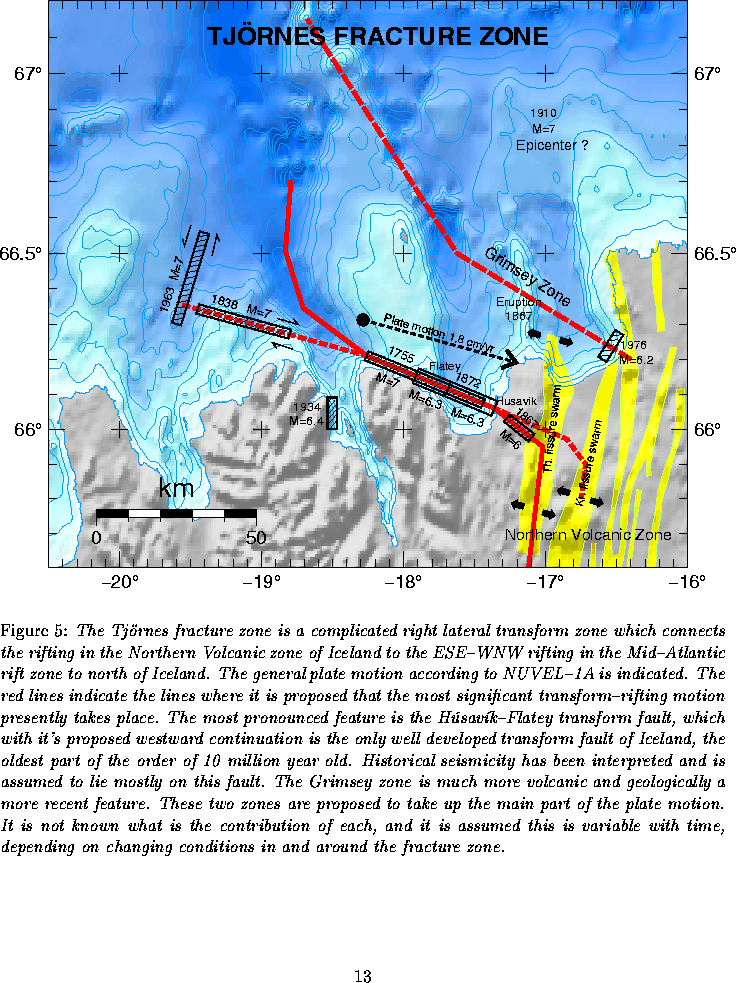
A tentative model of earthquake occurrence based mainly on data on historical
and recent seismicity and older geological data and tectonical interpretations
has been set up for the TFZ (Figure 5).
 |
Although much of the plate motion is proeebly taken up by a main transform fault it would be wrong to assume that the earthquakes on this fault would follow a simple kinematic model of stable/unstable strain release as a result of an even plate motion in its surrounding. Based on geological evidence it is indicated that during the last tens of thousands to hundreds of thousands of years it only takes up a small fraction of the total plate divergency. However the earthquake activity during the last 200-300 years suggests that presently most of the transform motion is taken up by this fault. Also it is evident from these data that large earthquakes repeat in a different manner on the same fault segments.
What is said here highlights the significance of earth realistic modelling of the present day general seismotectonic conditions in this zone for long or short term prediction of hazards.
Evidence from historical seismicity or the lack of evidence in the other
main risk zones highlight the same for these zones. We do no see
the repedition of ``nearly identical'' hazardeous earthquakes, highlighting
the significance of earthrealistic dynamic models for these zones.
 Development of methods using microearthquakes for monitoring
crustal instability
Development of methods using microearthquakes for monitoring
crustal instability
The SIL microearthquake system produces detailed results of automatic
analysis of large number of microearthquakes. To be able to work efficiently
with this kind of information a special interactive program had
previously been created. During the PRENLAB project, this program has now
been further developed
and allows now the results from single event location, from multievent
location, from fault plane solution, and from rock stress tensor inversion
as input. The program can now be used for steering results from one
analysis to another, for example can the relative locations give constraint
on the fault plane orientation which can be used in the input for both
fault plane solutions and rock stress tensor inversion. The development of
this interactive software has also required modifications in all other
software to facilitate the information flow between the different
algorithms.
The work detailed in this chapter is basically the responsibility
of Uppsala University, Department of Geophysics (UUPP.DGEO).
Methods for subcrustal mapping of faults
The algorithm for absolute and relative location of microearthquakes has been
implemented in the SIL system routine analysis.
This software has been applied in a search of crustal faults both in
the north, the TFZ, and the SISZ. This work has been
in cooperation with geologists within PRENLAB and these faults, found from the microearthquakes,
show a remarkable agreement with the fault information available from
sea bottom and land surveys. These studies also indicate the power of the
multievent location technique for discriminating the fault plane and the
auxiliary plane. An example of the results using this algorithm is shown in Figure 3.
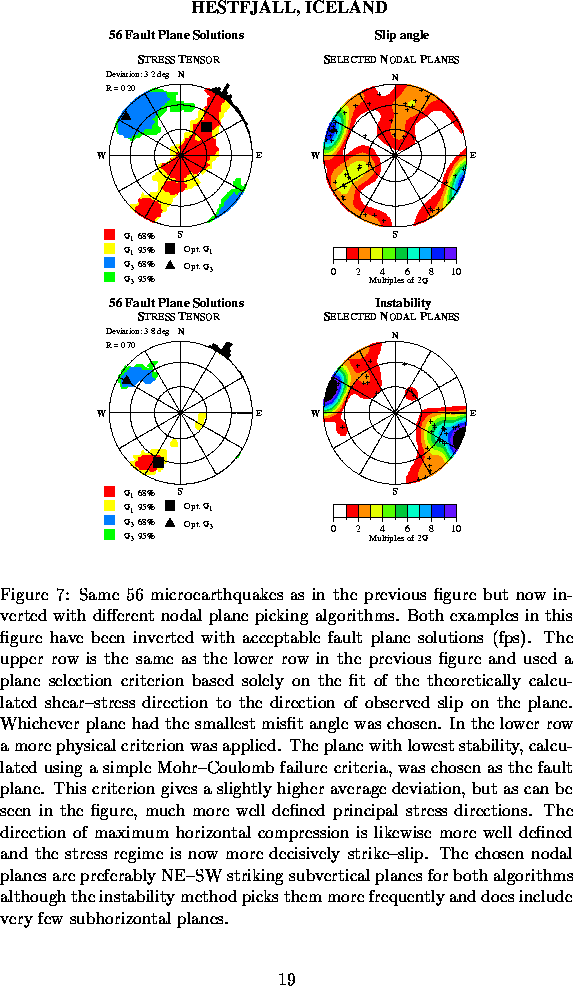
Methods for monitoring the local rock stress tensor
New methods and software have been developed to estimate a regional or local stress tensor based only on microearthquake focal mechanisms and locations. The inversion scheme is based on existing techniques which has been improved along two major lines of work.
 |
 |
Physical/rock-mechanical interpretation of microearthquake information
New methods are being worked on for using microearthquakes for monitoring crustal instability. During recent years, powerful methods for automatic analysis of microearthquakes
have been developed. They include reliable and robust algorithms for fault plane
solutions, high accuracy absolute and relative multievent location
techniques and stress tensor inversion algorithms. It is now also generally
recognized that the microearthquakes are important carrier of information
related to the crustal deformation processes. The full benefit of the
possibilities created by these developments require dense networks of
seismic stations with high clock accuracy. Such networks are now available
in many areas and older networks are being upgraded to reach the requirements.
In conclusion there are now possibilities to apply the algorithms and to
go into a more general physical/rock-mechanical interpretation of the information
carried by the microearthquakes.
Methods for monitoring of stable/unstable fault movements
Methods are in development for monitoring what usually is characterized
as aseismic fault movement by use of microearthquakes.
The commonly
observed interaction between microearthquakes, often over large distances
compared to the earthquake sizes, is most probably related to deformation
expressed by stable aseismic slip. Utilizing the extensive information carried
by the large amount of microearthquakes has the potential to find a rock-mechanical
connection between microearthquakes during episodic activity. In principal this
opens indirect possibilities to achieve knowledge about the aseismic fault slips.
Such an analysis may be performed by deducing possible aseismic fault movements from
the microearthquakes and vary unknown parameters to put the earthquakes into physical
chains of effects and consequences. This approach is totally physical
(rock-mechanical)
and can be expected, together with theoretical models, to develop
models of fault slip process. Such models based on laboratory studies have already
been proposed and have found great support from numerical modelling
and comparisons with earthquake observations.
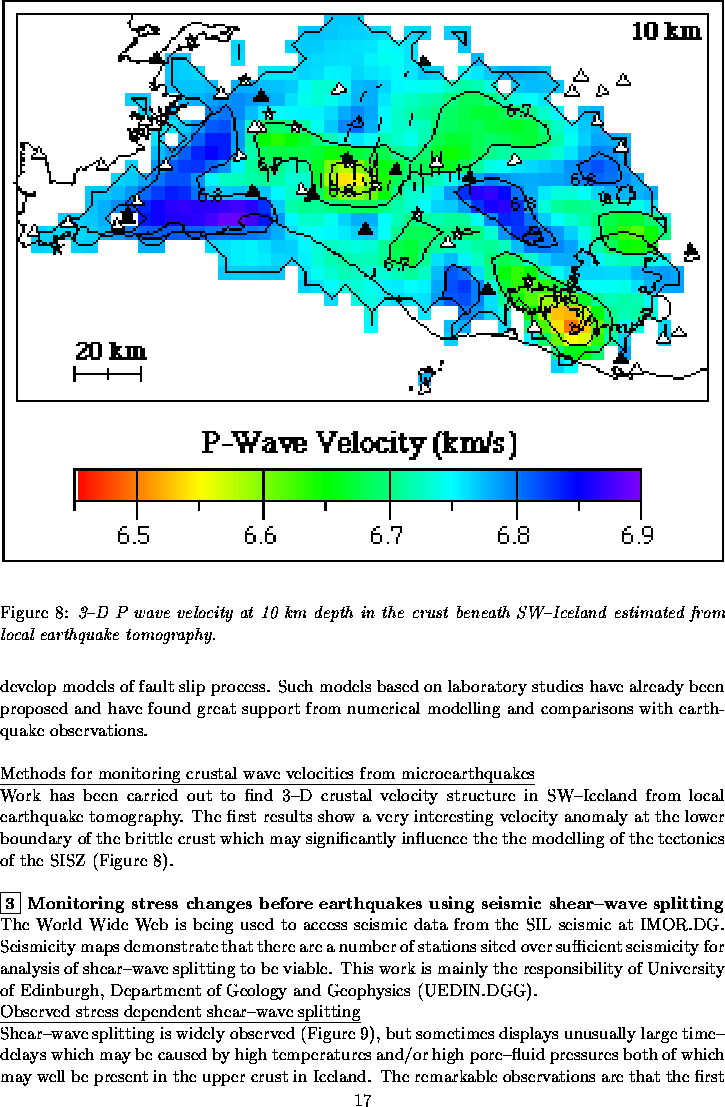
Methods for monitoring crustal wave velocities from microearthquakes
Work has been carried out to find 3-D crustal velocity structure
in SW-Iceland from local earthquake tomography. The first results show
a very interesting velocity anomaly at the lower boundary of the brittle
crust which may significantly influence the the modelling of the tectonics
of the SISZ (Figure 8).
 |
 Monitoring stress changes before earthquakes
using seismic shear-wave splitting
Monitoring stress changes before earthquakes
using seismic shear-wave splitting
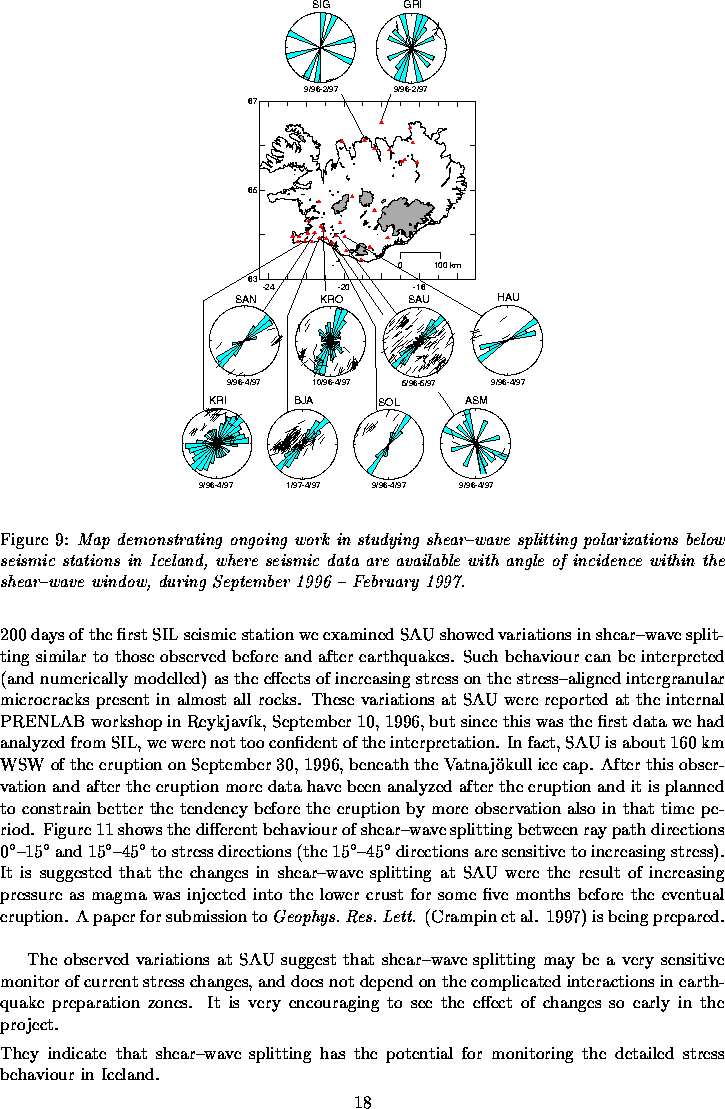
The World Wide Web is being used to access seismic data from the SIL
seismic at IMOR.DG.
Seismicity maps demonstrate that there are a number of
stations sited over sufficient seismicity for analysis of shear-wave
splitting to be viable. This work is mainly the responsibility of
University of Edinburgh, Department of Geology and Geophysics (UEDIN.DGG).
Observed stress dependent shear-wave splitting
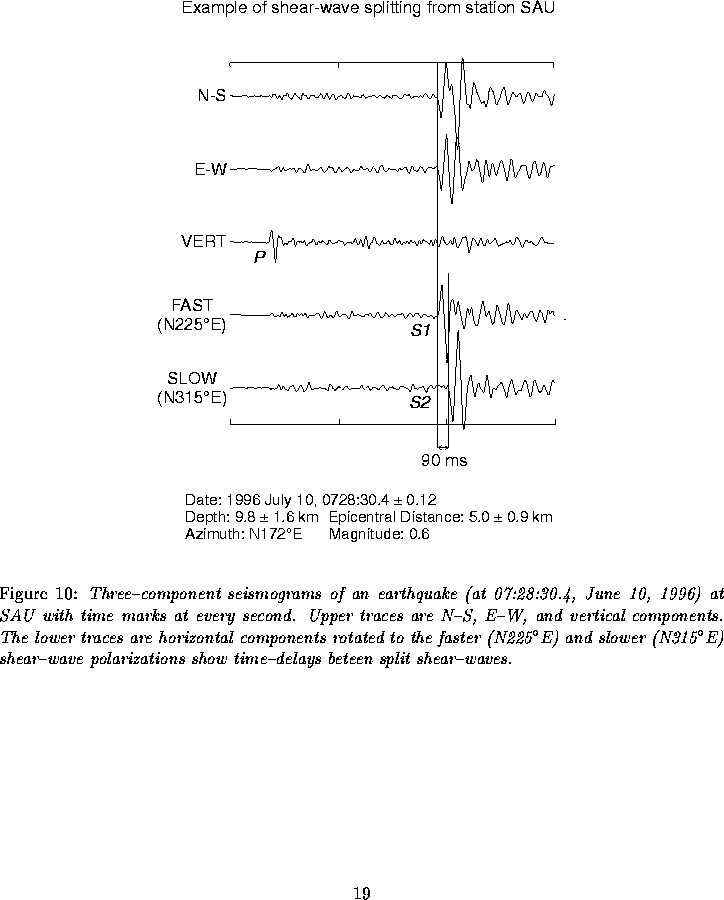
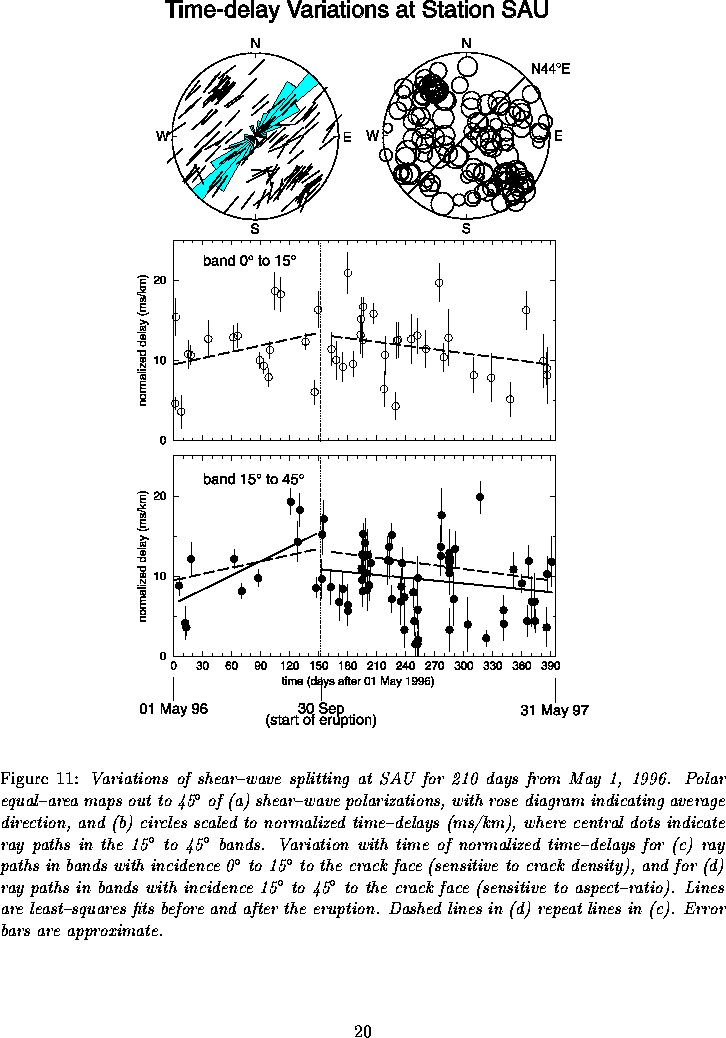
Shear-wave splitting is widely observed (Figure 9),
 |
 |
 |
 -15 and
15-45 to stress directions (the
15-45 directions are
sensitive to increasing stress). It is
suggested that the changes in shear-wave splitting at SAU were the
result of increasing
pressure as magma was injected into the lower crust for some five
months before the eventual
eruption. A paper for submission to Geophys. Res. Lett.
(Crampin et al. 1997) is being prepared.
-15 and
15-45 to stress directions (the
15-45 directions are
sensitive to increasing stress). It is
suggested that the changes in shear-wave splitting at SAU were the
result of increasing
pressure as magma was injected into the lower crust for some five
months before the eventual
eruption. A paper for submission to Geophys. Res. Lett.
(Crampin et al. 1997) is being prepared.
The observed variations at SAU suggest that shear-wave
splitting may be a very sensitive
monitor of current stress changes, and does not depend on the complicated
interactions in
earthquake preparation zones. It is very encouraging to see the effect
of changes so early in the project.
![\begin{Rothlist}
\item[$\bullet$] They indicate that shear--wave splitting has t...
...ts to improve
stress--monitoring of the crust beneath Iceland. \ \end{Rothlist}](img19.gif)
Identify optimum areas and developing routine techniques
The ongoing work of will gradually allow the identification of suitable
areas for deployment of more closely spaced SIL stations for more
effective studies of precursory changes. Development is planned
of routine techniques that can be used for real-time
monitoring of splitting parameters in Iceland.
 Borehole monitoring of fluid-rock interaction
Geophysical loggings
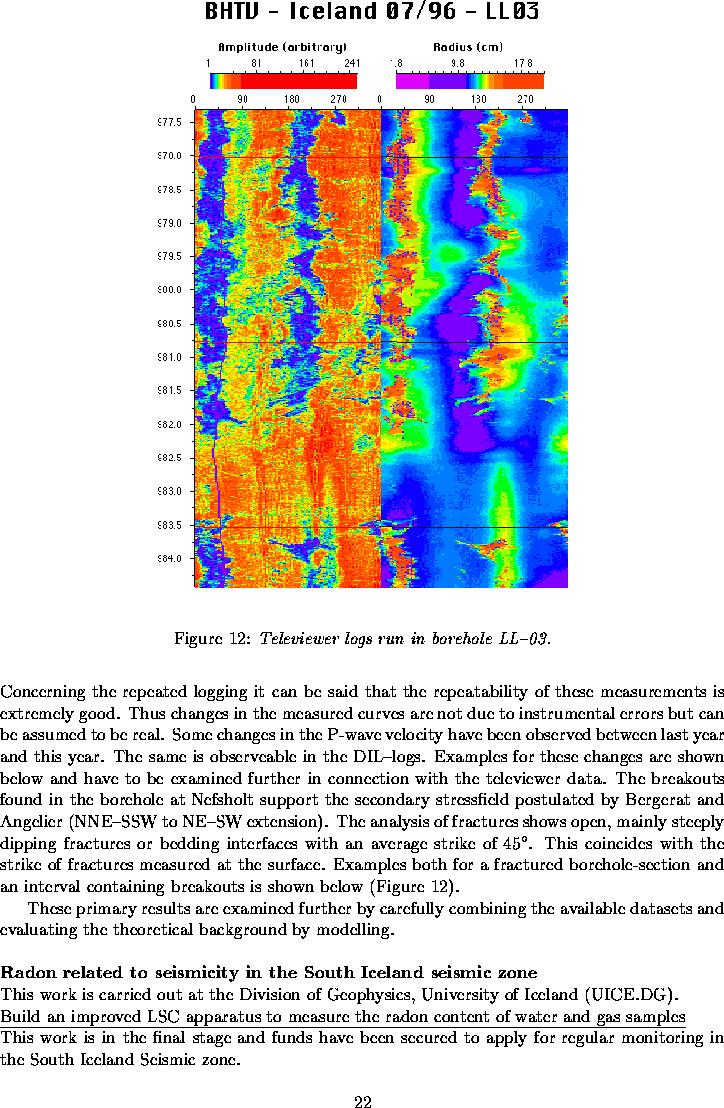
A pilot study is ongoing to obtain a time series of logs
in the South Iceland seismic zone (SISZ).
An 1100 m deep borehole (LL-03, ``Nefsholt'') inside the zone (63.92N, 20.41W,
7 km south of the seismic station SAU)
is used and provides the unique opportunity to perform measurements much nearer
to earthquake sources than usual - the hypocenter depths at that location range
between 6 and 9 km.
Moreover, data can be obtained for a depth interval of more than 1000 m,
uninfluenced by the sedimentary cover and less disturbed by surface noise.
In the preparational phase of an earthquake, stress accumulation is expected to be connected with the creation of borehole breakouts, changes in the number and size of cracks, a possible variation of the stress direction, etc. Therefore, the following set of geoparameters is monitored:
Temporal changes visible in these logs will be correlated with data obtained by other methods used in the whole project, seismicity, anisotropy observed in S-waves, crustal deformation, gravity, etc.
There are two main objectives: The first is to measure stress induced changes in physical parameters of rocks by repeated logging. The measured parameters are the acoustic velocity and the conductivity of the rock surrounding the borehole as well as the geometry and degree of fracturing of the borehole wall. The second aim is to get supplementary information about the stress field and its changes inside the SISZ by the detection of borehole breakouts.
This work is mainly under the responsibility of Stiftung Geoforschungszentrum
Potsdam, Division 5-Disaster research, Section 5.3-Deep Borehole
Logging (GFZ.DR.DBL). Besides the other partners of the PRENLAB there
is a special cooperation with Valgarður Stefánsson at the Icelandic
Energy Authority in this work.
Equipment and Methods
The following tools are used:
The borehole compensated sonic tool (BCS) to measure the P-wave
velocity of the rock, the dual-induction-laterolog (DIL) to get an
estimate of the resistivity in three different penetration depths, the
gamma-ray (GR) and spectral gamma-ray (SGR) tools to help evaluating
the lithological sequence, and the borehole televiewer which provides
a complete image of the borehole wall.
The BCS also allows registration of the whole wavetrain which is helpful
for fracture identification and distinguishing the different phases of
arriving waves.
With the BCS, the DIL and the GR several runs are performed one
immediately after the other. After a careful depth match these runs
are averaged. This procedure is repeated after different time intervals
and is intended to be continued.
So far, two repetitions have been performed, the first after a time
interval of three months, the second approximately one year later.
The borehole televiewer allows detection of borehole breakouts, which are
stress induced elongations of the borehole indicating the direction of
the greater horizontal principle stress. Additionally, fractures can be
picked in depth and azimuth and closed fractures can be distinguished
from open ones. Thus repeated televiewer-logging allows to observe
changes in borehole geometry and in opening of fractures.
Results
Concerning the repeated logging it can be said that the repeatability of
these measurements is extremely good. Thus changes in the measured curves
are not due to instrumental errors but can be assumed to be real.
Some changes in the P-wave velocity have been observed between last year
and this year. The same is observeable in the DIL-logs. Examples for
these changes are shown below and have to be examined further in connection with
the televiewer data.
The breakouts found in the borehole at Nefsholt support the
secondary stressfield postulated by Bergerat and Angelier
(NNE-SSW to NE-SW extension).
The analysis of fractures shows open, mainly steeply dipping fractures
or bedding interfaces with an average strike of 45. This coincides
with the strike of fractures measured at the surface. Examples both
for a fractured borehole-section and an interval containing breakouts is
shown below (Figure 12).
These primary results are examined further by carefully combining the
available datasets and evaluating the theoretical background by
modelling.
Radon related to seismicity in the South Iceland seismic zone
This work is carried out at the Division of Geophysics, University of
Iceland (UICE.DG).
Build an improved LSC apparatus to measure the radon content of water and gas samples
This work is in the final stage and
funds have been secured to apply for regular monitoring
in the South Iceland Seismic zone.
Revive the radon sampling program in South Iceland
A radon sampling program started in the South Iceland seismic zone in 1978, and samples were collected on a regular basis for 17 years. This monitoring will be revived with improved techniques, by using the improved LSC apparatus which is being developed. As a part of reviving the program an overview investigation has been carried out on observed interrelationship between seismic activity and radon signals. The main results of this can be summarized as follows.
![\begin{Rothlist}
\item[$\bullet$] Of all anomalies that could be expected from t...
...omalies were found, five of which
occurred prior to the eruptions.\end{Rothlist}](img22.gif)
 Active deformation determined from GPS and SAR
The objective is to measure crustal deformation, understand how it relates to
seismicity and distribution of faults, and use it for better understanding of earthquakes.
In particular, deformation monitoring will be used to improve the understanding
of elastic strain accumulation, tectonic setting of seismic zones, coseismic slip
during earthquakes, and aseismic slip on faults during interseismic periods.
The work is in first hand carried out by Centre National de la Recherche
Scientifique, UPR 0234-Dynamique Terrestre et Planétaire (CNRS.DTP) and
the Nordic Volcanological Institute (NVI) in special cooperation
with UUPP.DGEO, Uppsala University, UICE.DG Univesrity of Iceland
and Icelandic Meteorological Office (IMOR.DG).
Analysis of SAR images from the ERS-1 and ERS-2 satellites
Technique
In applying the SAR inteferometry the
entire deformation field is recorded with an unsurpassed spatial sampling density
( 1000 pixels/km2) at intermittent times. For the interferometry work
we have used data acquired by the European ERS-1 and ERS-2 statellites.
They pass over a given study area at an altitude
of 785 km, transmitting along ray paths at an average angle of 23 from the
vertical. These
satellites provide SAR images, each of which is a map of the ground
reflectivity sorted by range. The phase of each 4 by 20 m pixel measures
both the range and the phase shift due to reflection of the wave from the
ground surface. The latter quantity can be eliminated between two images of
the same area if the dielectric characteristics of the ground remain
constant and the orbits satisfy the conditions necessary for coherence.
The remaining path
difference, known only to within an integer number of wavelengths, contains
information from three sources: relative orbital positions, topography as
seen in stereo by the satellite from slightly different orbital passes, and
any change in position of the ground. From a suitable pair of images, we
reconstruct the phase of each pixel using a phase-preserving correlator.
We adjust the satellite orbital parameters to
minimize the number of fringes at the four corners of the image, assuming
that the far field displacement is negligible. The stereoscopic path
difference is eliminated using a digital elevation model. The resulting
interferogram is a contour map of the change in range, i.e. the component
of the displacement which points toward the satellite.
Each fringe corresponds to one cycle (28 mm or half the 56 mm
wavelength) of the ERS-1 SAR. The accuracy of the measurement is better
than several cm in range.
1000 pixels/km2) at intermittent times. For the interferometry work
we have used data acquired by the European ERS-1 and ERS-2 statellites.
They pass over a given study area at an altitude
of 785 km, transmitting along ray paths at an average angle of 23 from the
vertical. These
satellites provide SAR images, each of which is a map of the ground
reflectivity sorted by range. The phase of each 4 by 20 m pixel measures
both the range and the phase shift due to reflection of the wave from the
ground surface. The latter quantity can be eliminated between two images of
the same area if the dielectric characteristics of the ground remain
constant and the orbits satisfy the conditions necessary for coherence.
The remaining path
difference, known only to within an integer number of wavelengths, contains
information from three sources: relative orbital positions, topography as
seen in stereo by the satellite from slightly different orbital passes, and
any change in position of the ground. From a suitable pair of images, we
reconstruct the phase of each pixel using a phase-preserving correlator.
We adjust the satellite orbital parameters to
minimize the number of fringes at the four corners of the image, assuming
that the far field displacement is negligible. The stereoscopic path
difference is eliminated using a digital elevation model. The resulting
interferogram is a contour map of the change in range, i.e. the component
of the displacement which points toward the satellite.
Each fringe corresponds to one cycle (28 mm or half the 56 mm
wavelength) of the ERS-1 SAR. The accuracy of the measurement is better
than several cm in range.
Main results
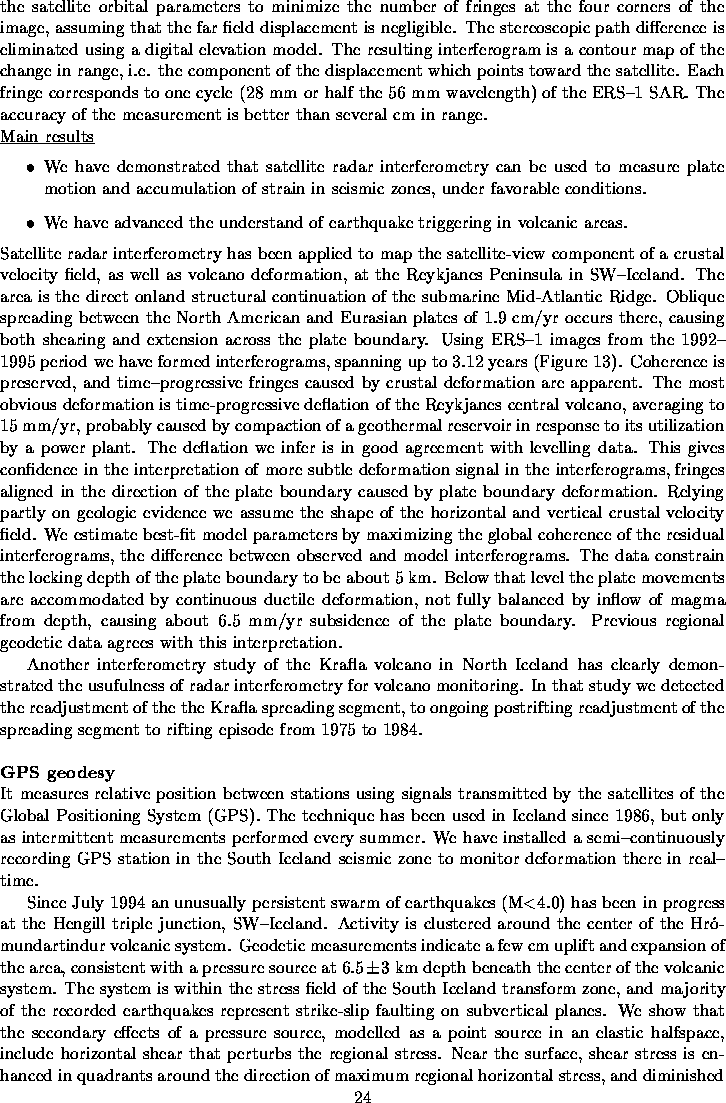
Satellite radar interferometry has been applied to map the satellite-view
component of a crustal velocity field, as well as volcano
deformation, at the Reykjanes Peninsula in SW-Iceland. The area
is the direct onland structural continuation of the submarine
Mid-Atlantic Ridge.
Oblique spreading between the North American
and Eurasian plates of 1.9 cm/yr occurs there,
causing both shearing and extension across
the plate boundary. Using ERS-1 images from the 1992-1995
period we have formed interferograms, spanning up to 3.12
years (Figure 13).
 |
Another interferometry study of the Krafla volcano in North Iceland
has clearly demonstrated the usufulness of radar interferometry for
volcano monitoring. In that study we detected the readjustment of the
the Krafla spreading segment, to ongoing postrifting readjustment of
the spreading segment to rifting episode from 1975 to 1984.
GPS geodesy
It measures relative position between stations using signals transmitted by the satellites of the Global Positioning System (GPS). The technique has been used in Iceland since 1986, but only as intermittent measurements performed every summer. We have installed a semi-continuously recording GPS station in the South Iceland seismic zone to monitor deformation there in real-time.
Since July 1994 an unusually persistent swarm of earthquakes
(M<4.0) has been in
progress at the Hengill triple junction, SW-Iceland. Activity
is clustered around the center of the Hrómundartindur volcanic system. Geodetic
measurements indicate a few cm uplift and expansion of the area, consistent
with a pressure source at 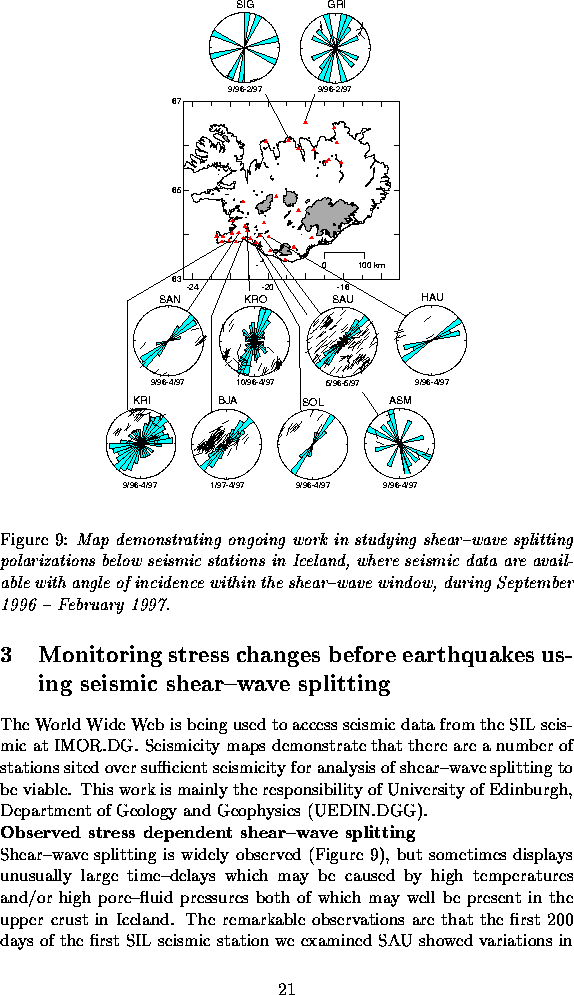 km
depth beneath the center of the volcanic system.
The system is within the stress field
of the South Iceland transform zone, and majority of the recorded earthquakes
represent strike-slip faulting on subvertical planes. We show that the secondary
effects of a pressure source, modelled as a point source in an elastic halfspace, include
horizontal shear that perturbs the regional stress. Near the surface,
shear stress is enhanced in quadrants around the direction of maximum
regional horizontal stress,
and diminished in quadrants around the direction of minimum regional stress. The
recorded earthquakes show spatial correlation with areas of enhanced shear. The
maximum amount of shear near the surface caused by the expanding pressure source
exceeds 1 millistrain, sufficient to trigger earthquakes if the crust in the area was
previously close to failure.
km
depth beneath the center of the volcanic system.
The system is within the stress field
of the South Iceland transform zone, and majority of the recorded earthquakes
represent strike-slip faulting on subvertical planes. We show that the secondary
effects of a pressure source, modelled as a point source in an elastic halfspace, include
horizontal shear that perturbs the regional stress. Near the surface,
shear stress is enhanced in quadrants around the direction of maximum
regional horizontal stress,
and diminished in quadrants around the direction of minimum regional stress. The
recorded earthquakes show spatial correlation with areas of enhanced shear. The
maximum amount of shear near the surface caused by the expanding pressure source
exceeds 1 millistrain, sufficient to trigger earthquakes if the crust in the area was
previously close to failure.
 Formation and development of seismogenic faults and fault
populations
Formation and development of seismogenic faults and fault
populations
This work includes extensive geological field work and theoretical work
based on that, concentrating on the South Iceland
seismic zone (SISZ) and the Tjörnes fracture zone (TFZ). It also includes
geodetic investigation and compðarison of results and methods with
seismological investigations. The partners mostly responsible for this
work are the Nordic Volcanological Institute (NVI) and
the Centre National de la Recherche Scientefique, URA 1759-Tectonique (CNRS.TT).
There is very close collaboration with all the other partners in this work,
especially with University of Bologna (UBLG.DF),
Icelandic Meteorological Office (IMOR.DG) and Uppsala University (UUPP.DGEO).
Also there is cooperation with Thierry Villemin of Université de Savoie and
Olivier Dauteuil, Geosciences Rennes, in France.
Paleostress tensor
The paleostress tensors of 25 localities in the SISZ have been made, using
fault-slip datasets and compared to focal mechanisms of earthquakes in
the SIL data set. Preliminary studies
of the paleostress field in the TFZ were carried out during
the summer of 1997.
Stress fields and mechanisms of seismogenic faults
In the South Iceland Seismic Zone (SISZ), the recent and present-day tectonic mechanisms are studied by geological and geophysical means. The determination of the stress regimes is done through calculation of stress tensors, involving the use of inverse methods. Data inversion is applied in a nearly identical way to fault slip data and to sets of double-couple focal mechanisms of earthquakes.
The methodology applied includes following four geological and geophysical criteria: (1)the consideration of the nodal plane attitude (strike and dip), as compared with that of all geological faults and planes of mechanical weakness known from field observation at sites, geological mapping and aerial photograph analyses; (2) the comparison with the recent fault mechanisms observed in the field (including pitch and sense of motion as well as strike and dip of fault); (3) the mechanical likelihood of each of the two fault solutions, based on taking friction into account (e.g., a shallow dip is more likely than a steep one for a reverse fault); (4) the best fit criterion relative to the stress tensors calculated. If external (i.e., comparisons with geological tensors), it is of good value. If internal (i.e., the nodal planes resulting in the best possible fit within the data inversion process), it is somewhat circular, hence disputable.
The systematic use of the four criteria for nodal plane selection within a
weighted approach allowed more accurate determination of the stress regimes
in the SISZ than earlier studies and thus better understanding of the geological significance of the
earthquake mechanisms.
Determination of the paleostress tensor in the SISZ
In the South Iceland Seismic Zone (SISZ) present-day tectonic activity is
mainly associated with a conjugate system of NNE-trending right-lateral
strike-slip faults and ENE-trending left-lateral ones ; NW-trending faults
are also present. All these faults affect basaltic lavas and hyaloclastites,
Upper Tertiary-Pleistocene to Post-Glacial in age, in the SISZ where we
collected about 700 brittle tectonic data at 25 sites. The major stress regime, a NW-SE trending
extension, includes 70% of the total population of faults, whereas the minor
one, a NE-SW trending extension, includes 30%. Of a total of 718 fault slip
data, 55% indicate primarily normal-slip and 45% primarily strike-slip. The
ratio normal/strike-slip faults is lower than in other areas in Iceland. The above results
indicate that the dominating stress field in the SISZ favours strike-slip
faulting, with an horizontal  axis trending approximately WNW-ESE to
NW-SE. We point out, however, that in addition, there is a contrasting
minor, stress field, characterized by approximately NNE-SSW to NE-SW
extension. These results were compared to the stress regimes determined from
earthquake focal mechanisms. This
comparison reveals that the paleostress and stress regimes are identical and
that the changes in the stress field of the SISZ are characterized by stress
permutations between
axis trending approximately WNW-ESE to
NW-SE. We point out, however, that in addition, there is a contrasting
minor, stress field, characterized by approximately NNE-SSW to NE-SW
extension. These results were compared to the stress regimes determined from
earthquake focal mechanisms. This
comparison reveals that the paleostress and stress regimes are identical and
that the changes in the stress field of the SISZ are characterized by stress
permutations between  and
and 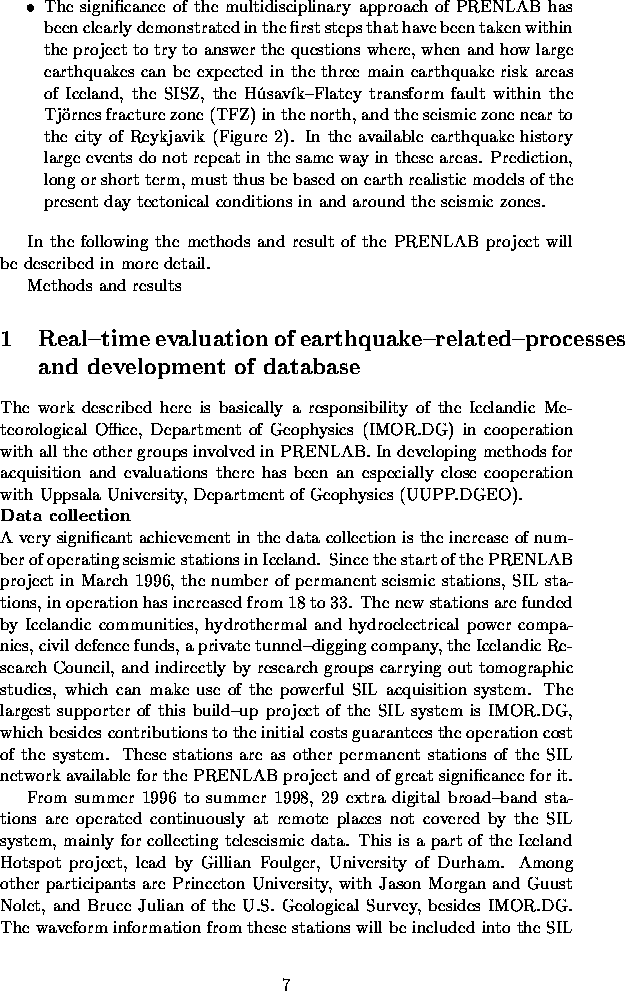 and between and .
Determination of the paleostress tensor in the TFZ
During the summer of 1997 a very detailed study was made of the paleostress field of the Tjornes Fracture Zone. The study was carried out at several sites within the on-land part of the fracture zone on the Flateyjarskagi peninsula, as well as at several sites to the south of the zone itself, on the Flateyjarskagi peninsula. In addition, fault-slip data sets were collected along the eastern part of the Dalvik lineament.
Preliminary results indicate a rather complex stress history of the Tjornes Fracture Zone, particularly in the in-land parts on the north coast of Flateyjarskagi. The data sets are currently being analysed in more detail, and it is hoped that the final results will be ready in early 1998.
The paleostress data from the Tjornes Fracture Zone and the Dalvik linement
will be compared with the current seismic data from these areas and with
results of geodetic work and other ongoing geological investigation ongoing
in the area.
Field and theoretical studies of fault populations
Detailed study of faults in the TFZ and the SISZ
Maps have already been made of some of the most important faults in the Holocene part of the South Iceland Seismic Zone.
Detailed field data on faults in the Pleistocene part of the South Iceland Seismic Zone have also been collected.
An analytical study has been made of the controlling stress field and the secondary fracture pattern of the best-exposed faults in the Holocene part of the South Iceland Seismic Zone.
As regards the Tjornes Fracture Zone, field studies were made in the summer of 1997 of the infrastructure of the on-land parts of that zone at the north coast of the Flateyjarskagi peninsula. This work focused on the overall evolution of the fault rock from large-scale blocks, bounded by major faults, to fault breccia and crushed rock. The results indicate that many parts of the Tjornes Fracture Zone contain zones of completely crushed rock where the crustal movements may be mostly by aseismic creep.
Another aspect of the work on the infrastructure of the Tjornes Fracture
Zone concerns the effects of crustal fluids on faulting in that zone. The
results indicate that there are sets of very intense mineralisation that
presumably formed in areas of transtension along the main strike-slip fault.
Detailed tectonic map of the TFZ
A detailed set of GPS points within and in the vicinity of the Tjornes Fracture Zone was installed in 1994 by the NVI. This network was extended in 1995 and again in the summer of 1997 by T. Villemin and his group. Altogether there are now 44 GPS points in this area. In 1997 32 points were remeasured, as well as the 12 new points. The results from 1997, compared with 1995, are not yet available but should be so in early 1998.
Mapping of the whole Krafla Fissure Swarm has also been made and a detailed
map og the junction between the Husavik Fault and the rift zone is under the
way. A SAR study is planned of the
Tjornes Fracture Zone and its junction with the rift zone.
Boundary-element studies of the TFZ
New general model for the crustal deformation and the distribution of
seismicity within the Tjornes Fracture Zone are being developed, combining the results of analytical and
boundary-element studies with the field results.aldsson.
Analog models of the the TFZ
This work is focused on large-scale Holocene
crustal deformation in the area south of the Tjornes Fracture Zone using
glacio-morphological data. The purpose of this work is partly to try to
detect the Holocene crustal deformation in the area that could be related to
the controlling stress field of the Tjornes Fracture Zone.
 Theoretical analysis of faulting and earthquake processes
This involves modelling of earthquake and rifting related space
and time behaviour of the stress field in Iceland. The modelling
work is based on results of geological, seismological and geodetic
investigations. The main responsible partners for this work are
Department of Physics, University of Bologna (UBLG.DF) and
Geoforschungscentrum Potsdam (GFZ.DR.DBL). This work is based on
the work of all other partners.
Crust-mantle rheology in Iceland and mid-atlantic ridge from studies of post-seismic rebound
Here the modelling work is focussed on modelling various aspects of the stress and displacement fields due to earthquakes and rifting epizodes in Iceland. Emphasis is posed on the interaction between the two processes following
stress relaxation in the asthenosphere. From these studies we may obtain a
significantly improved understanding of the space and time relationships
between earthquakes and other geophysical phenomena governing the state of
stress in the crust.
Global studies of post-seismic and post-rifting rebound in Iceland were performed employing spherical, radially stratified Earth model. Earthquakes and rifting episodes are modeled in terms of suitable distributions of equivalent body forces. The method of solution is based on a spectral approach to the equations which govern the deformations of a spherical Earth due to seismic sources located within the crust. The method, has the advantage of including a realistic mantle layering and a self-consistent description of the gravitational effects. Post-seismic and post-rifting deformation are proved to be significant transient components of plate motion.
Studies on a local scale are performed employing the theory of elastic dislocations in layered media. Comparison is constantly made with observations obtained in the framework of structural geology.
Near field studies on the stress field induced by ridge activity are
performed employing original methods of theoretical fracture mechanics in
plane-strain configuration. The singular integral equations governing fault
and ridge dynamics are solved by means of suitable polynomial expansions,
yielding a linear inverse problem which is solved by standard numerical
methods.
Far-field displacement field following rifting episodes By means of a viscoelastic model we have computed the deformations associated with the dynamics of a spreading ridge in a spherical, rheologically stratified Earth. A simple Earth model is preliminarly employed, which includes a 100-km thick elastic lithosphere, a uniform mantle with Maxwell rheology, and a fluid inviscid core. The source of deformation consists of a 200-km long tensile fault buried at a depth of 50 km. Figure 14 portrays the
coseismic surface displacement u (in centimeters) observed at a given distance
from the fault along different azimuths alpha (namely, 0, 45 and 90 degrees
from top to bottom). The surface displacement is decomposed along the
spherical unit vectors r,  , and
, and 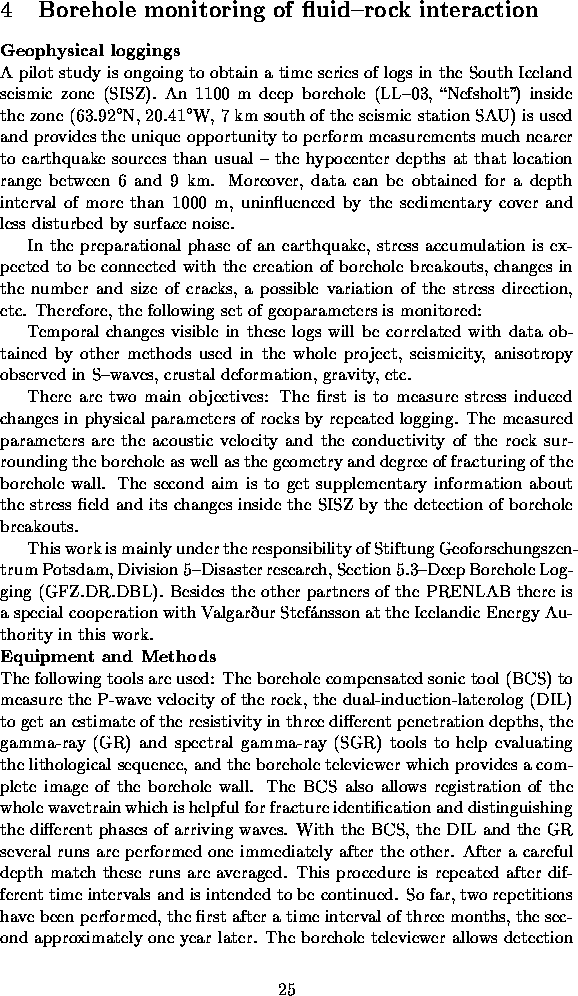 (dash-dotted, solid, and
dotted curves, respectively).
Figure 15 shows the long term relaxation of the
(dash-dotted, solid, and
dotted curves, respectively).
Figure 15 shows the long term relaxation of the
and r components of displacements. Another interesting
feature of Figure 15 is the large spatial scale of the region experiencing
horizontal motions in the postseismic regime. Stress changes induced by magma uprise in a layered medium
Magma ascent through a mid-oceanic ridge can be modeled as a tensile crack
within which the overpressure is determined by magma buoyancy. Explicit
analytic solutions are given for the elementary dislocation problem in the
most simple layered medium, made up of two welded half spaces characterized by
different elastic parameters. Particularly interesting appears to be the case
of a crack cutting across the boundary between the two media. In this case a
further singularity appears in the kernel of the integral equation, which is
connected with the presence of the boundary surface. The problem can be solved
by splitting the crack into two interacting open cracks. The application of a
constant overpressure within the crack is found to produce drastically
different stress regimes in neighbouring regions located on opposite sides of
the interface; this feature may provide a straightforward explanation
for the episodic reversal (from sinistral to dextral) of strike-slip
mechanisms observed in the South-Iceland seismic zone. If the rheological
discontinuity between the lithosphere and the asthenosphere is considered,
model results predict a much larger horizontal flow in the asthenosphere than
is accomplished by motion of lithospheric plates. Furthermore, the stress
field near the transition depth is strongly controlled by differential shear
flow in the asthenosphere, thus yielding a simple explanation for the
different stress regimes prevailing in the seismogenic zones of Iceland.
Figure 16 shows graphically a result of great interest in interpreting Iceland
Surface cracks in fault regions as indicators of the state of stress
Most earthquakes in the South Iceland Seismic Zone occur on NNE-trending
dextral and ENE-trending sinistral strike-slip faults. Many of the earthquake
fractures rupture the surface in basaltic (pahoehoe) lava flows of Holocene
age. The resulting rupture zones display complex en-echelon patterns of
secondary structures including arrays of (mostly) NE-trending fractures and
hillocks (push-ups). The field data indicate that the arrays consist of both
mixed-mode cracks and pure mode-I cracks, concentrated in a narrow belt
trending in the direction of the strike-slip faults in the Pleistocene bedrock
buried by the Holocene lava flows. For the dextral faults, the angle between
the strike of the fault array and the strike of individual secondary fractures
ranges over several tens of degrees, but is commonly 10-30 degrees. Modeling
indicates that if the arrays consist of pure tension (mode-I) fractures, the
angle between the strike of the hidden fault and each tension fracture must be
between 22.5 (if the prestress dominates with respect to the seismic
stress) and 45 (if the prestress is negligible), assuming that
faulting occurs according to the Coulomb-Navier failure criterion and the
prestress is purely deviatoric. If the arrays consist of mixed-mode cracks,
the angle between the fault strike and individual cracks is lower than
22.5, this value being attained if the seismic stress dominates
(Figure 17). Modeling suggests that all fractures, being narrowly concentrated
Comparison between flat and spherical earth models
Two different approaches were compared to the study of post-seismic
deformations. In the first one, we considered a flat earth model forced
by a vertical strike-slip fault embedded in an elastic lithosphere. In the
second one, we have solved the same problem in spherical geometry. In both
cases, we have computed the coseismic displacements and the delayed
post-seismic displacements associated with the viscoelastic relaxation of a
uniform mantle. In Figure 18 we compare coseismic (left) and postseismic (right)
Modelling the Earthquake Related Space-Time Behaviour of the Stress Field in the Fault System of Southern Iceland
To model the space-time development of the stress field using data on strain and stress changes from the other experiments and from databases.
In detail, this aims at the modelling of
Following models are addressed:
Methods and results
The modeling is performed by applying static dislocation theory to geodetic data and data obtained through seismic moments from seismic measurements. The method and software used allows to calculate displacements, strain and stresses due to double couple and extensional sources in layered elastic and inelastic earth structures. Besides the change in displacement during seismic or other short lived events, the changes caused by the movement of plates can be included.
The existing programs programs have been tuned for faster performance and extended to allow calculation of six instead of five layers to account for detailed knowledge of velocity depth profiles.
Preparational study has been made on the influence of several layers, i.e. their elastic constants and thickness, on surface deformation. Doing so, special attention was paid to the effects of the physical properties of the source layer on amplification or diminishing displacement at the surface.
Data are gathered on strong (historical) earthquakes on Iceland and its surroundings.
Two models are being prepared:
The models include both faults and the load due to the Katla, Hekla etc.
volcanoes, i.e. driving forces from rifting and from the mantle plume below
Iceland.
Acknowledgements
PRENLAB is funded by the European Commission as a part of
the Environment and Climate Programme, Climatology and
Natural Hazards, Seismic Risk. This is acknowledged. Special
thanks to the scientific officer Maria Yeroyanni for help
and guidance. I acknowledge also the support of
the institutions of the partners of this project for their
significant contriburion. Special thanks to
the Icelandic Meteorological Office, headed by
the director Magnús Jónsson, for its financial and
administrative contribution.
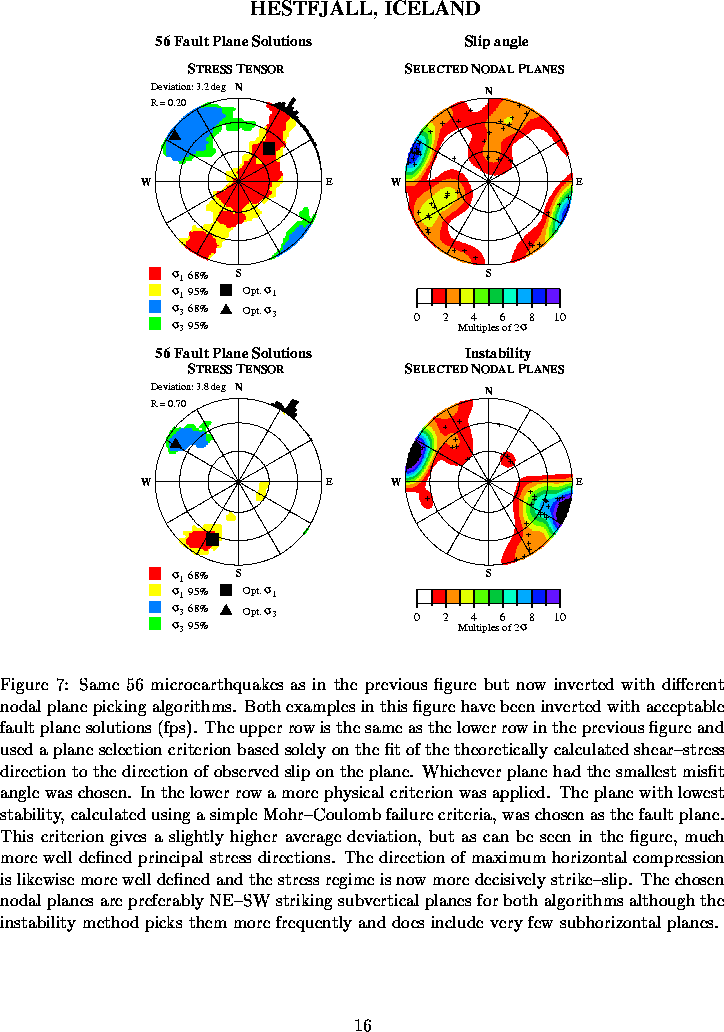
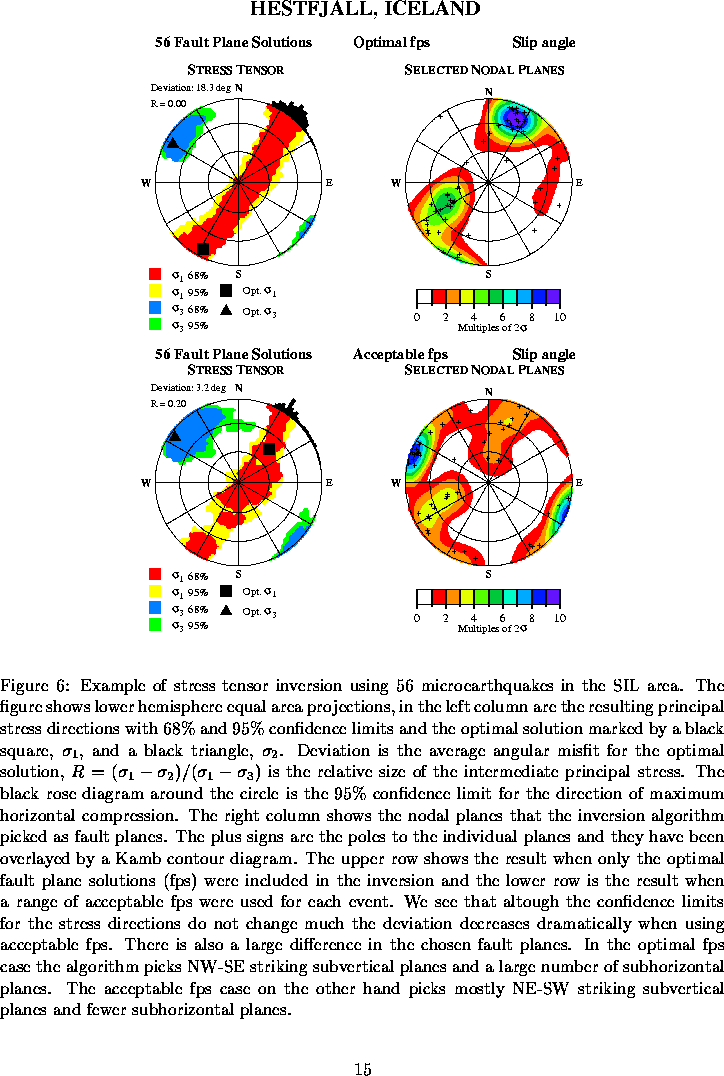
 is the relative size of the
intermediate principal stress. The black rose diagram around the circle
is the 95% confidence limit for the direction of maximum horizontal
compression. The right column shows the nodal planes that the inversion
algorithm picked as fault planes. The plus signs are the poles to the
individual planes and they have been overlayed by a Kamb contour diagram.
The upper row shows the result when only the optimal fault
plane solutions (fps) were included in the inversion and the lower row is the
result when a range of acceptable fps were used for
each event. We see that altough the confidence limits for the stress
directions do not change much the deviation decreases dramatically when
using acceptable fps. There is also a large difference in the chosen
fault planes. In the optimal fps case the algorithm picks NW-SE striking
subvertical planes and a large number of subhorizontal planes. The acceptable fps
case on the other hand picks mostly NE-SW striking subvertical planes
and fewer subhorizontal planes.
is the relative size of the
intermediate principal stress. The black rose diagram around the circle
is the 95% confidence limit for the direction of maximum horizontal
compression. The right column shows the nodal planes that the inversion
algorithm picked as fault planes. The plus signs are the poles to the
individual planes and they have been overlayed by a Kamb contour diagram.
The upper row shows the result when only the optimal fault
plane solutions (fps) were included in the inversion and the lower row is the
result when a range of acceptable fps were used for
each event. We see that altough the confidence limits for the stress
directions do not change much the deviation decreases dramatically when
using acceptable fps. There is also a large difference in the chosen
fault planes. In the optimal fps case the algorithm picks NW-SE striking
subvertical planes and a large number of subhorizontal planes. The acceptable fps
case on the other hand picks mostly NE-SW striking subvertical planes
and fewer subhorizontal planes.