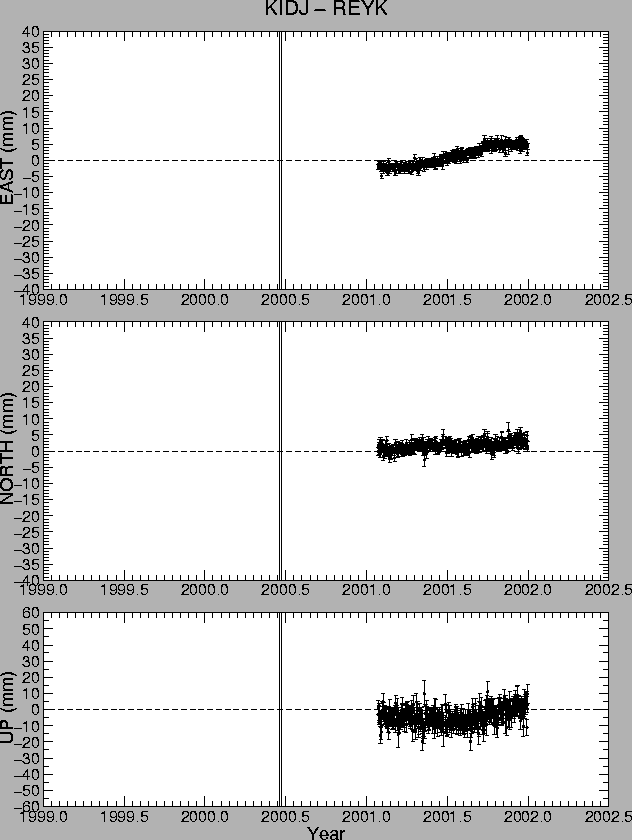
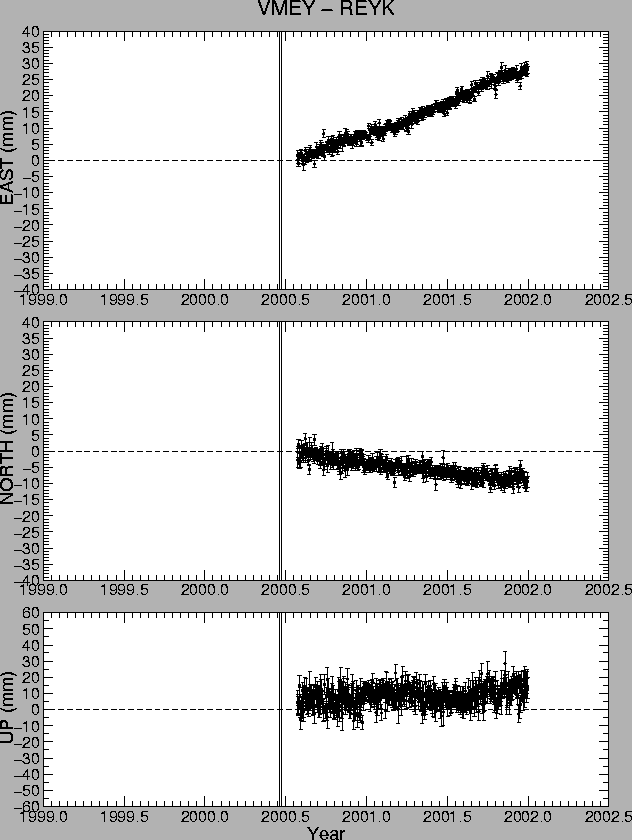
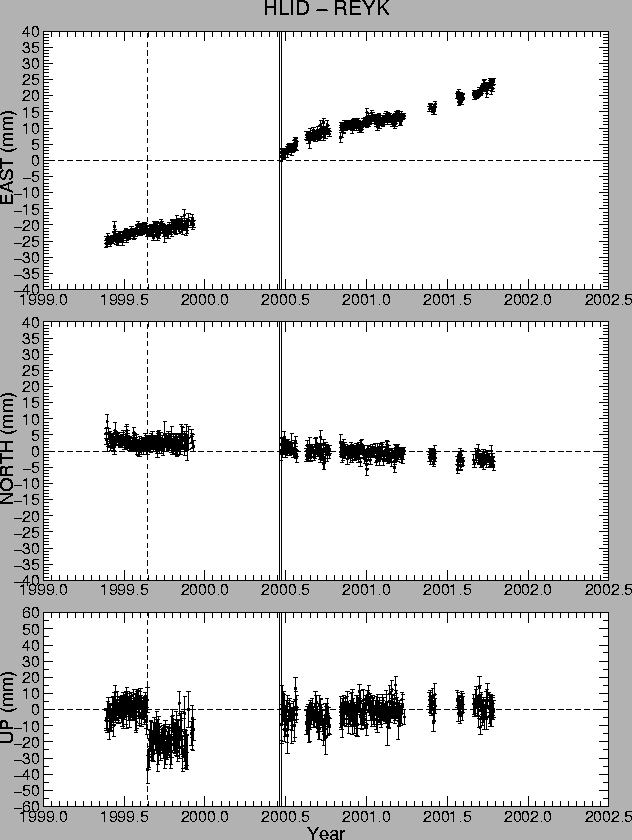
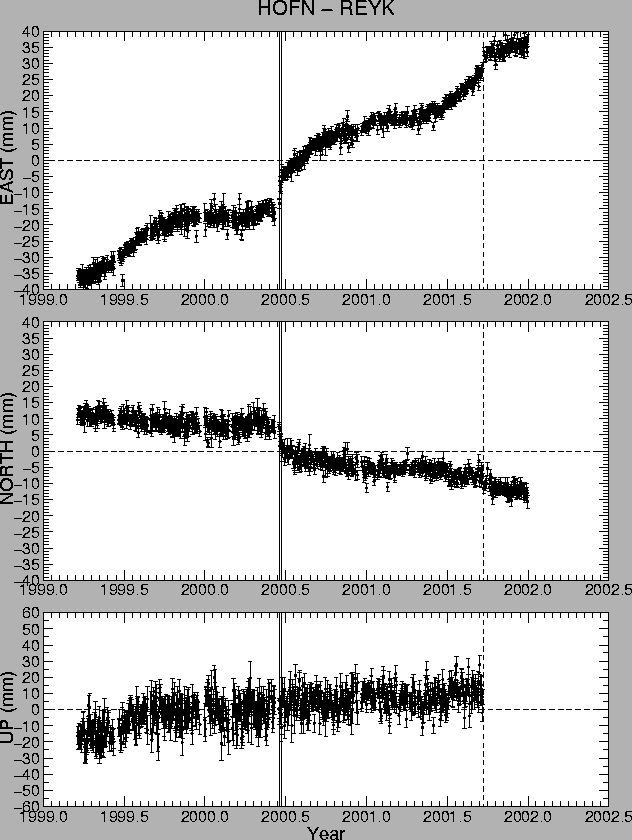
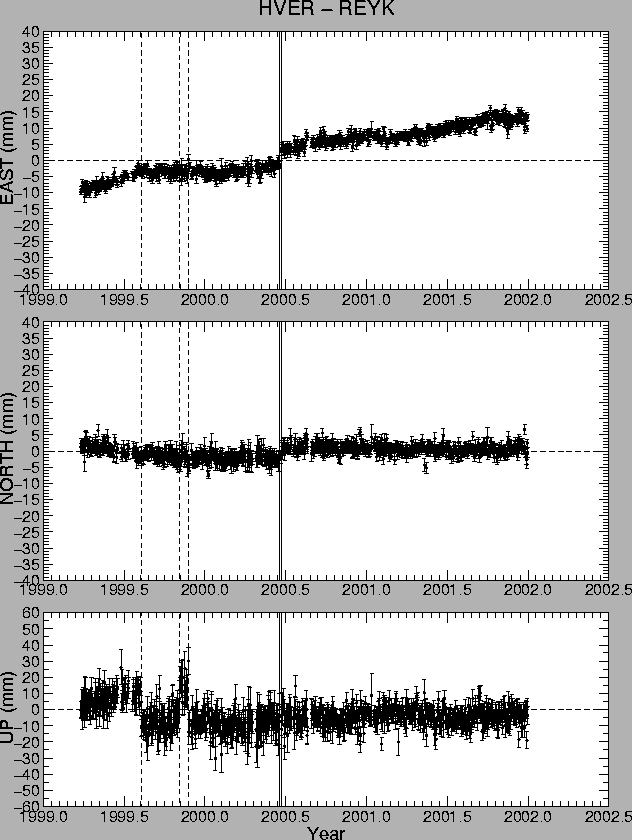
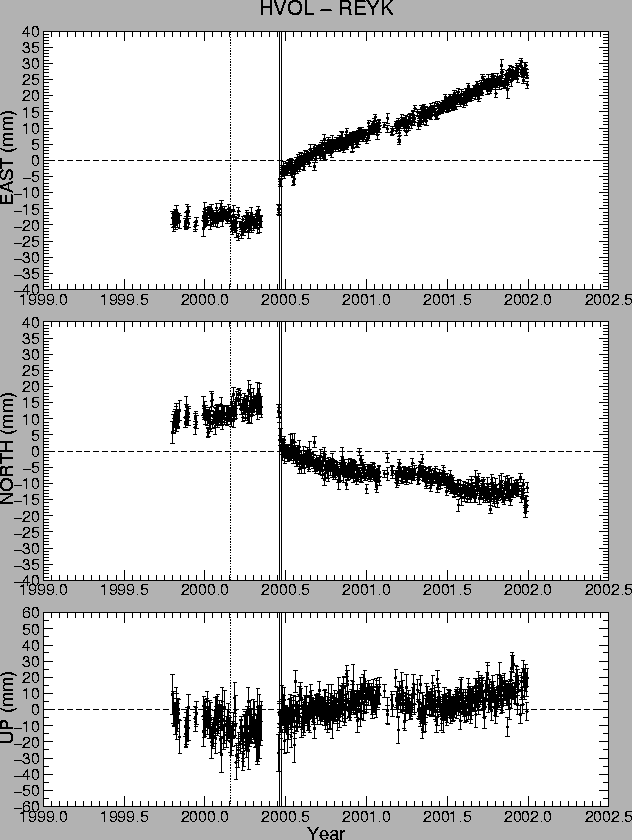
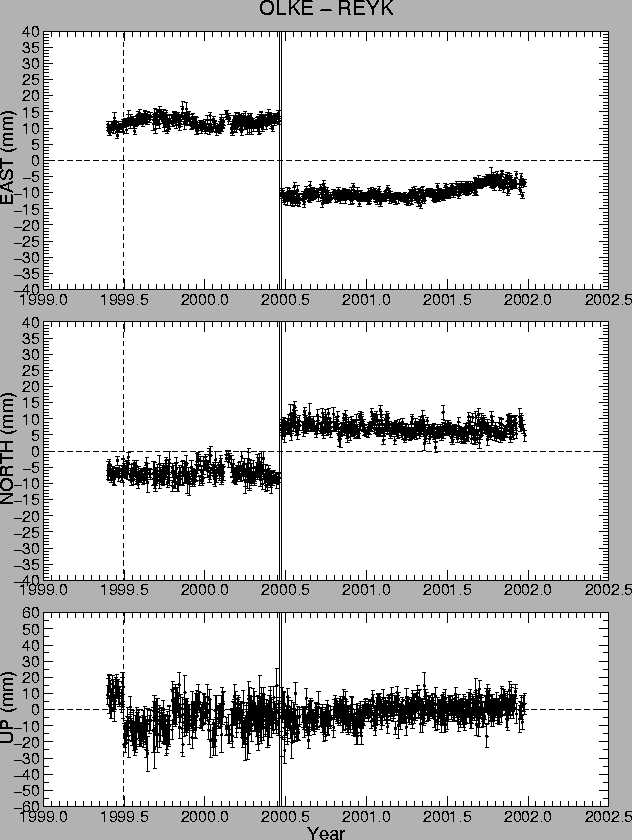
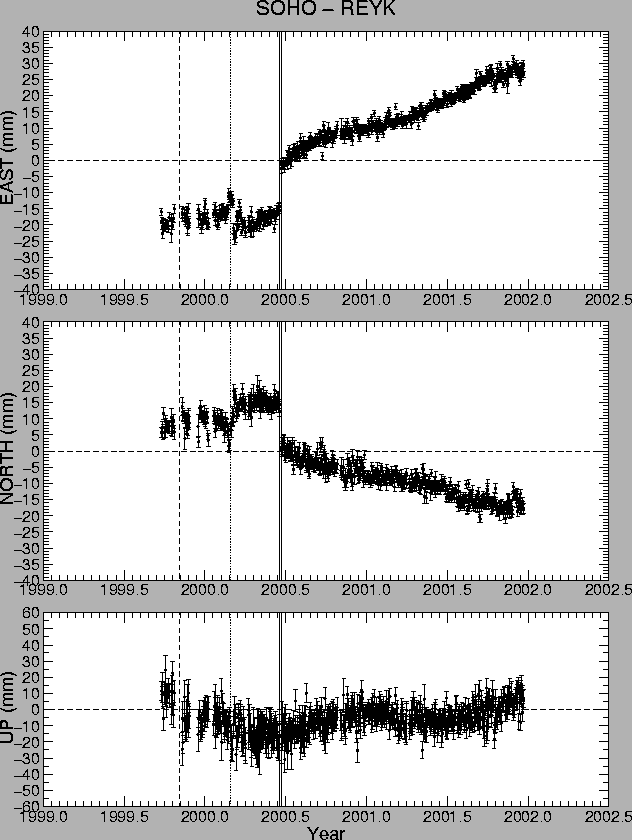
In the time series shown in Figures 8 to 20 outliers have been removed (Section 3.2) and the formal coordinate errors have been scaled by 4.0 and 2.5 in the horizontal and vertical components respectively. The time series span the period from the beginning of measurements (Table 1) to December 31, 2001. The longest time series span nearly three years (e.g. VOGS), but the stations in the north (RHOF and AKUR) have short time series since they were installed in the summer of 2001. The time series are of excellent quality. The values of the weighted standard deviation (WSTD) in Table 4 represent the short-term scatter in the time series. The values are lowest in the east direction, from 0.8 mm (VOGS) to 1.4 mm (SOHO), and largest in the vertical component, ranging from 4.2 mm (KIDJ) to 6.8 mm (AKUR). WSTD ranges from 1.0 mm (KIDJ) to 1.8 mm (SOHO) in the north component.
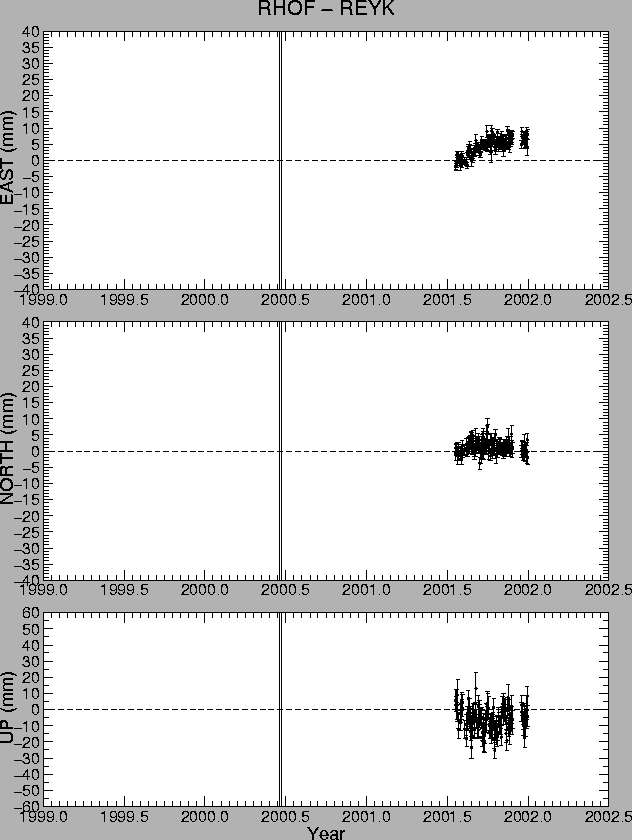
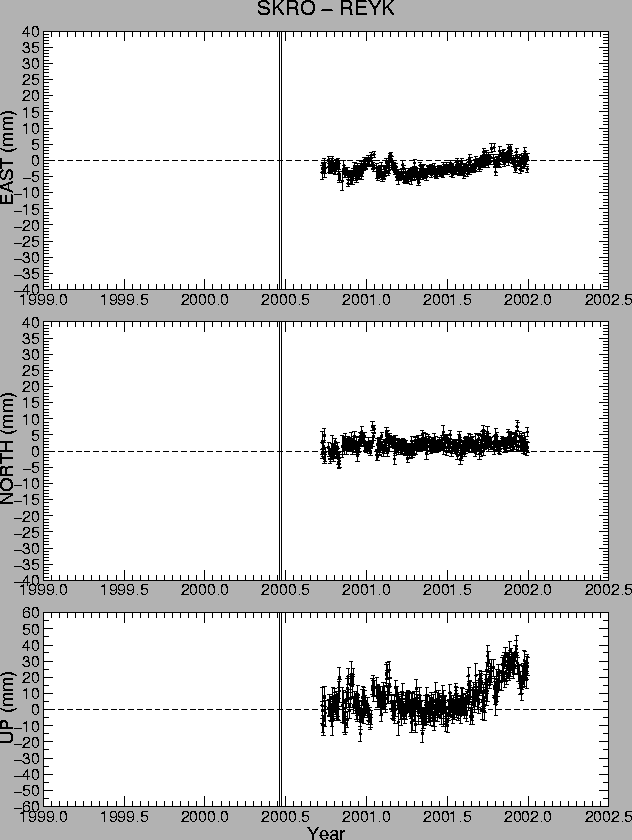
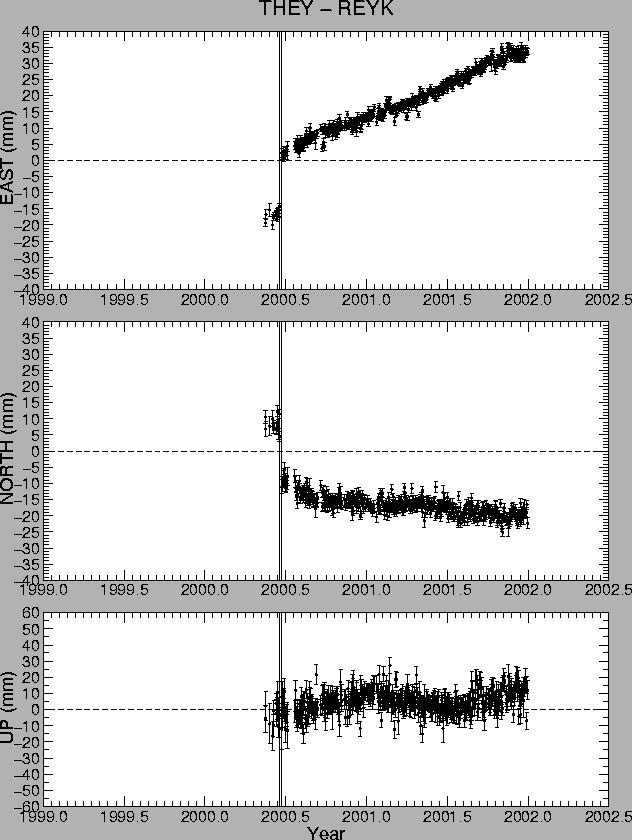
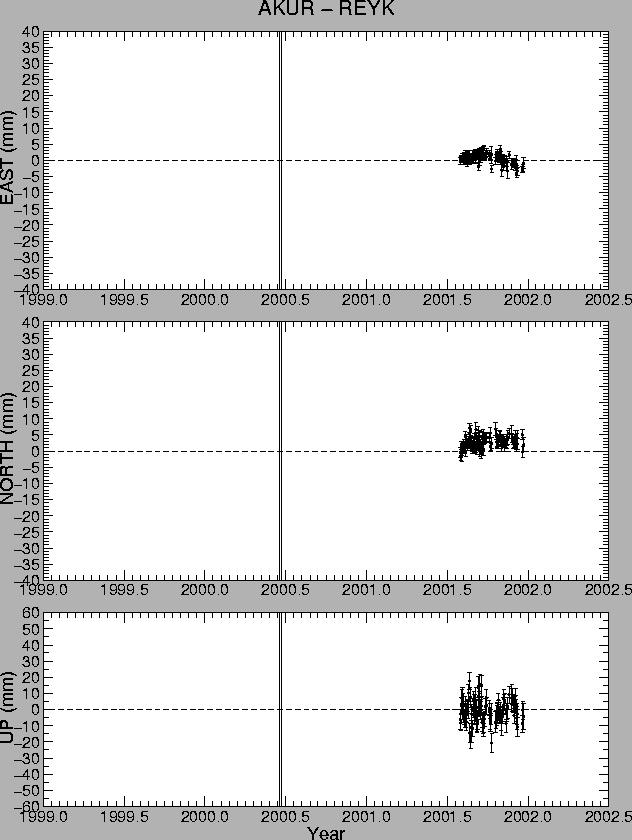
The horizontal components in the time series (Figures 8 to 20) are dominated by the plate movements, seen as gradual displacements towards east and south for stations on the Eurasian plate (HLID, VOGS, VMEY, THEY, SOHO, HVOL, HOFN and RHOF). Stations on the North-American plate show nearly no movement in the horizontal components (OLKE, SKRO and AKUR) because the reference station REYK is on the North-American plate.
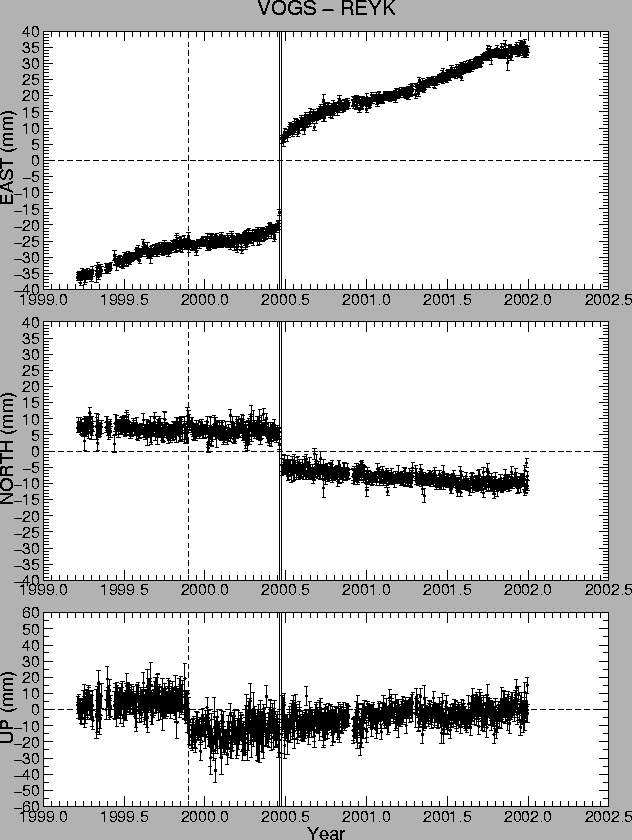
Displacements in the time series due to the two large earthquakes in the SISZ in June 2000 [Stefánsson et al. (2000)], [Árnadóttir et al. (2001)], [Pedersen et al. (2001)] are visible in the time series as offsets at the stations recording at the time (OLKE, HVER, VOGS, HVOL, SOHO, HOFN and HLID) and are marked with solid vertical lines in Figures 8 to 20. The SISZ earthquakes will be discussed in more detail in Section 4.6.
Offsets of approximately 20 mm in the vertical components at HLID, HVER, OLKE, SOHO and VOGS (marked with dashed lines in Figures 9, 11, 14, 17 and 20) are due to installation of plastic radomes (Figure 3) which will be discussed in Section 4.1.1.
The time series at HLID (Figure 9) has many gaps. The antenna at HLID is occasionally covered with snow in the wintertime up to one or two meters thick. The data from such epochs are easily detected as spurious motion towards east, south and up and is omitted from the time series. The station is presently operated in a semi-continuous manner (Section 2). Although HOFN has been recording since 1997, we only started using data from the station when the first ISGPS station was installed in March 1999 (VOGS). In September 2001 the antenna type at HOFN was changed (Table 2) resulting in significant offsets in the time series (6 mm east, 2 mm south and 74 mm up, see Figure 10). A small offset in the east component at HVOL (Figure 12) is observed during a period of power failure in February to March 2001. No equipment changes were made during the period. A signal from the Hekla 2000 eruption (start of eruption marked with a vertical dotted line in Figure 12) can be seen. This signal is further enhanced in the time series at SOHO (Figure 17). The Hekla eruption will be discussed in more detail in Section 4.5.
The time series for SKRO (Figure 16) includes spurious motions in all coordinate components during wintertime. Some of these data have already been removed in the outlier detection process. The east component shows suspicious movements towards east in December 2000 and January to February 2001. The vertical component is also behaving in a strange manner. The station is in central Iceland at high elevation. We believe that the offsets are either due to snow and icing on the antenna radome, or because the quadripod is not fastened to solid bedrock. Rime and icing up to approximately 20 cm thick have been observed to accumulate assymmetrically on the radome (J. Hólmjárn, personal communication 2002). However, it is unlikely that this explains the long-term vertical offsets observed in the winter of 2001 to 2002 because in that case we would expect the variations to be more rapid. If the spurious signals observed at SKRO were from the earth, say from a magma chamber beneath Bárðarbunga volcano, we would also expect to see long term changes in the horizontal components.
HOFN seems to be moving at a highly variable rate (Figure 10), relative to REYK, towards east. This is also observed at other stations in the east component, e.g. at VOGS (Figure 20). When a linear trend is removed from the time series, an annual oscillation in the coordinates is revealed (Figure 6). The signal is most obvious in the east component. The amplitudes vary from 3 to 8 mm between stations, and all the stations are moving in phase. This phenomenon is not observed in the north component of the time series. It is uncertain, at this stage, what the seasonal signal is meaning and if it is real at all. The seasonal signal could be a measurement artifact, caused by movement of the reference station REYK - or to be more precise, caused by movement of the building that REYK is on top of. The periodic signal could also originate from the data processing, e.g. due to unsufficient modelling of troposphere or tides (solid earth and pole) [Hugentobler et al. (2001)].
Periodic variations in GPS time series have been observed in numerous other studies. [Murakami and Miyazaki (2001)] report observations of periodic signals in GPS time series in Japan and relate them to major earthquake occurrence. The annual amplitudes in their study are of order of 3-9 mm in the horizontal components and are in phase. The authors consider various error sources and conclude that the periodicity is a real signal from the solid part of the earth, although the driving mechanism remains unknown. [Heinert and Perlt (2002)] suggest that seasonal variations in the positions at REYK and HOFN are related to loss of seismic energy in the SISZ. [Poutanen et al. (2001)] report on periodic signals in GPS time series from Finland with periods from one day to one year. They propose that some of the periodicities are due to modelling error in tropospheric parameters, but admit that the physical origin of many periods is uncertain. [Heki (2001)] concludes that seasonal variation in Northeast Japan are caused by snow load.
The subject of seasonal variations in the time series needs to be
studied in more detail before we can conclude if the signal is
from the crust or just a measurement artifact.
 |
 |
 |
 |
 |
 |
 |
 |