Such a sequence started at 15:40:41 GMT on June 17, 2000, with an earthquake of moment magnitude
MW=6.5. The hypocenter was located at 64.97![]() N, 20.37
N, 20.37![]() W and
6.3 km depth. A second event of MW=6.4 followed at 00:51:47 GMT on June 21, 2000.
The hypocenter was located at 63.98
W and
6.3 km depth. A second event of MW=6.4 followed at 00:51:47 GMT on June 21, 2000.
The hypocenter was located at 63.98![]() N, 20.71
N, 20.71![]() W and depth 5.1 km
[Stefánsson et al. (2000)].
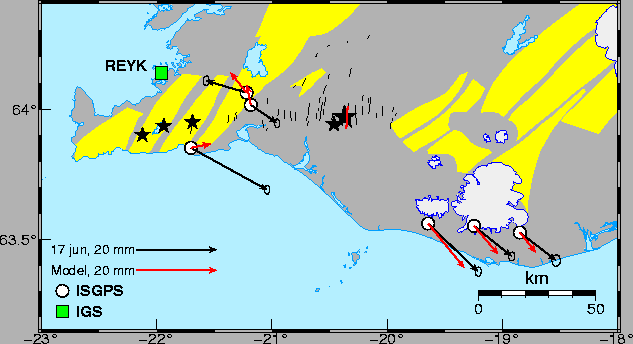
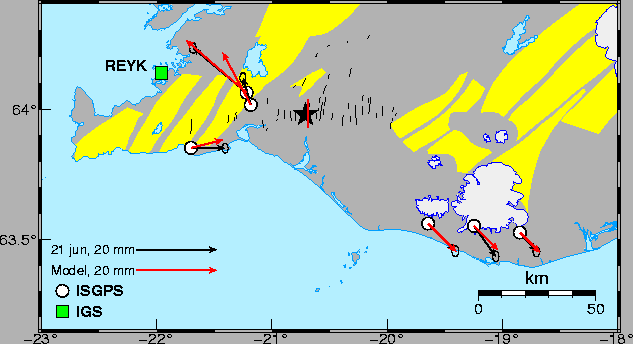
The epicenters are marked with large stars in Figures
36 and 37. The two large earthquakes occurred on N-S trending faults as
indicated by location of the aftershocks
[Stefánsson et al. (2000)],
geodetic measurements
[Árnadóttir et al. (2001)],
[Pedersen et al. (2001)]
and mapping of surface fractures
[Einarsson et al. (2000)].
W and depth 5.1 km
[Stefánsson et al. (2000)].
The epicenters are marked with large stars in Figures
36 and 37. The two large earthquakes occurred on N-S trending faults as
indicated by location of the aftershocks
[Stefánsson et al. (2000)],
geodetic measurements
[Árnadóttir et al. (2001)],
[Pedersen et al. (2001)]
and mapping of surface fractures
[Einarsson et al. (2000)].
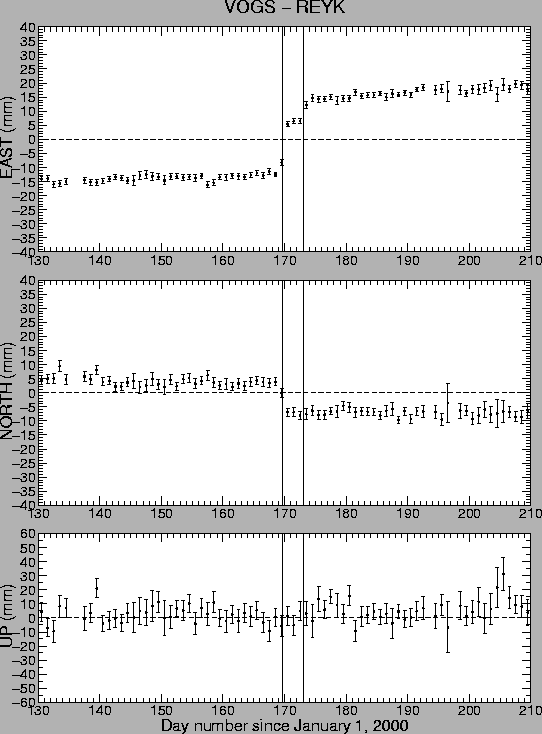 |
A significant coseismic deformation signal was observed at all operational ISGPS stations for both the main earthquakes. Figure 35 shows an 80 day long time window from VOGS covering the times of the earthquakes. The coseismic displacements due to each of the large earthquakes can easily be separated. The weighted average of the coordinates is calculated for three time intervals, using data from 10 days before the earthquakes, three days between the earthquakes and 10 days after the earthquakes. The coseismic displacements for each earthquake are then obtained by calculating the diffrences of the coordinates. REYK is assumed to remain fixed during the earthquakes. Results are listed in Table 9. The errors are estimated as four times the formal error resulting from the weighted average (see Section 3.1). Vertical displacements were insignificant at all stations. The cosesismic displacements observed at the operational stations are shown as vectors in Figures 36 and 37. Station HLID was not in operation at the time of the earthquakes. HVOL was not in operation until June 15, 2000, when a new wind generator was installed. Thus there are only two days of data behind the weighted average of coordinates prior to the earthquakes at HVOL.
HOFN was excluded from routine processing of the data from June 7 until June 16. That is why there are missing values for HOFN in Table 9. When HOFN was included in the daily processing, the formal errors of the daily coordinate results were larger by a factor of two and offsets as large as 20 mm west and 10 mm north (at SOHO) were observed. The offsets occurred 10 days prior to the June 17 earthquake and were at first interpreted as a precursor for the large earthquake sequence, but when HOFN was excluded from the processing the formal errors came back to normal values and the spurious offsets disappeared from the time series. It is not known why HOFN had such an impact on the coordinate results but perhaps it is due to some kind of instrumental error.
The displacements, assuming REYK is fixed, at VOGS are larger on June 17 than on June 21, although the June 21 earthquake is closer to VOGS and the earthquakes have similar magnitudes. This implies that other earthquakes on the same day contributed to the observed signal on June 17. In Figure 36 three stars noting earthquakes with moment magnitudes greater than 4.5 are on the Reykjanes peninsula. These earthquakes are believed to be triggered by the large earthquake (K. Vogfjörð, personal communication 2002) and occur at times (from east to west): 15:41:06, 15:41:11 and 15:45:27 GMT. InSAR interferometric results of the Reykjanes peninsula and GPS network measurements carried out in July 2000 and April to June 2001 show clearly significant deformation associated with the Reykjanes peninsula earthquakes on June 17 [Pagli et al. (2002)], [Árnadóttir et al. (2002)]. The largest deformation is observed near Kleifarvatn.
Figures 36 and 37 (black arrows) show that the coseismic offsets at HVER
are not consistent for the two earthquakes. One would expect the
direction of the displacements to be similar. Árnadóttir et al. (2001)
modelled the geometry and displacements of the faults using GPS network campaign
data from 1995, 1999 and 2000 (June 19-30).
The displacements
at the ISGPS stations are compared with modelled displacements supplied by
Þóra Árnadóttir for each large earthquake in Figures 36 and 37,
assuming REYK is fixed.
The observed offsets at stations to the east (THEY, SOHO and HVOL)
due to the June 17 earthquake (Figure 36, Table 9) agree
 |
 |
The reference station REYK is within the deformation field for
the June 17 and 21 earthquakes. The coseismic displacements of REYK can
be estimated with three different methodes: 1) using the model of
[Árnadóttir et al. (2001)];
2) HOFN is well outside the deformation
field of the earthquakes so changes in the baseline REYK-HOFN for the June 21
earthquake can be attributed to REYK; 3) using data from international
analysis centers that include REYK in their processing.
The predicted coseismic displacements for REYK are
1 mm west, 2 mm north the June 17 event and 3 mm west, 3 mm north for the
June 21 event (Þ. Árnadóttir, personal communication 2002).
The predicted displacements for HOFN are less than 1 mm (Þ. Árnadóttir, personal communication 2002).
We can thus attribute the coseismic displacements observed at HOFN (Table 9)
to REYK resulting in 3.6 ![]() 1.1 mm west and 4.2
1.1 mm west and 4.2 ![]() 1.2 mm north coseismic
displacement for REYK due to the June 21 earthquake, in good agreement with
the predicted displacements.
Visual inspection of time series of REYK from international data processing
centers like [SOPAC (2002)] and [MIT (2002)] reveals offsets
ranging from 5 to 8 mm towards west and from 4 to 7 mm towards north for
the combined displacements due to the earthquakes.
1.2 mm north coseismic
displacement for REYK due to the June 21 earthquake, in good agreement with
the predicted displacements.
Visual inspection of time series of REYK from international data processing
centers like [SOPAC (2002)] and [MIT (2002)] reveals offsets
ranging from 5 to 8 mm towards west and from 4 to 7 mm towards north for
the combined displacements due to the earthquakes.