Eruption in Grímsvötn in November 2004 |
 |
| Department - Earthquakes- GPS -Tremor -Strain- Related links - Staff & email - Coworkers and reports- Icelandic - webmaster@vedur.is PREPARED |
An eruption started in Grímsvötn in the evening of November 1, 2004
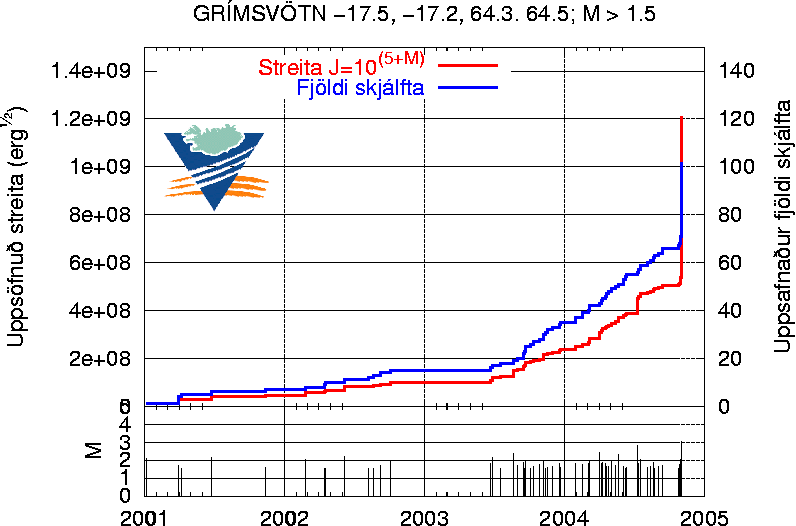
Since mid year 2003 earthquake activity has increased in the Grímsvötn area. The plot below shows the cumulative number of earthquakes (blue line) and the cumulative strain release (red line) in the area since 2001.
From mid August 2004, tremor bursts (about 30 minutes in duration) have been observed at the station Grímsfjall (grf, see map below). The energy of the bursts is mainly in the frequency band 1 - 3 Hz, which suggests increased geothermal activity (see week 33 and tremor plot from grf). On October 11 icequakes were recorded at the station Kálfafell (kal, see map below) (spikes in tremor plot). A few of these icequakes were located in western Skeiđarárjökull. Assuming the locations are accurate the icequakes were within the subglacial catchment of the Súla River. It was therefore assumed that they were either triggered by a small jökulhlaup from Grćnalón Lake or were due to increased rainfall in the area (see week 42). No sign of increased conductivity in the Skeiđará River was yet visible in the recordings of the Hydrological Service.
In the week October 18 - 24, a periodic tremor pulse became visible at the station Grímsfjall, with an energy of 2 - 8 Hz. At the same time earthquake activity in the Grímsvötn area increased. The earthquakes were mostly small, around magnitude 1 (see week 43). At the beginning of the following week (Oct. 25 - 31) the earthquake magnitude increased to about 2 (see week 44) and at the end of the week nearly 40 earthquakes had been located in the area.

About two weeks prior to the Grímsvötn eruption the continuous GPS station at Skrokkalda (SKRO, see map below), at a distance of 56 km from the eruption site, started recording a displacement. From Oct. 18 - 26 the station rose and was displaced by 7 mm to the west, which suggests an intrusion into a magma chamber at some depth beneath Grímsvötn. It is possible that such an intrusion, increasing the melting of the ice, allowed an earlier release of the jökulhlaup, which began on Oct. 30.
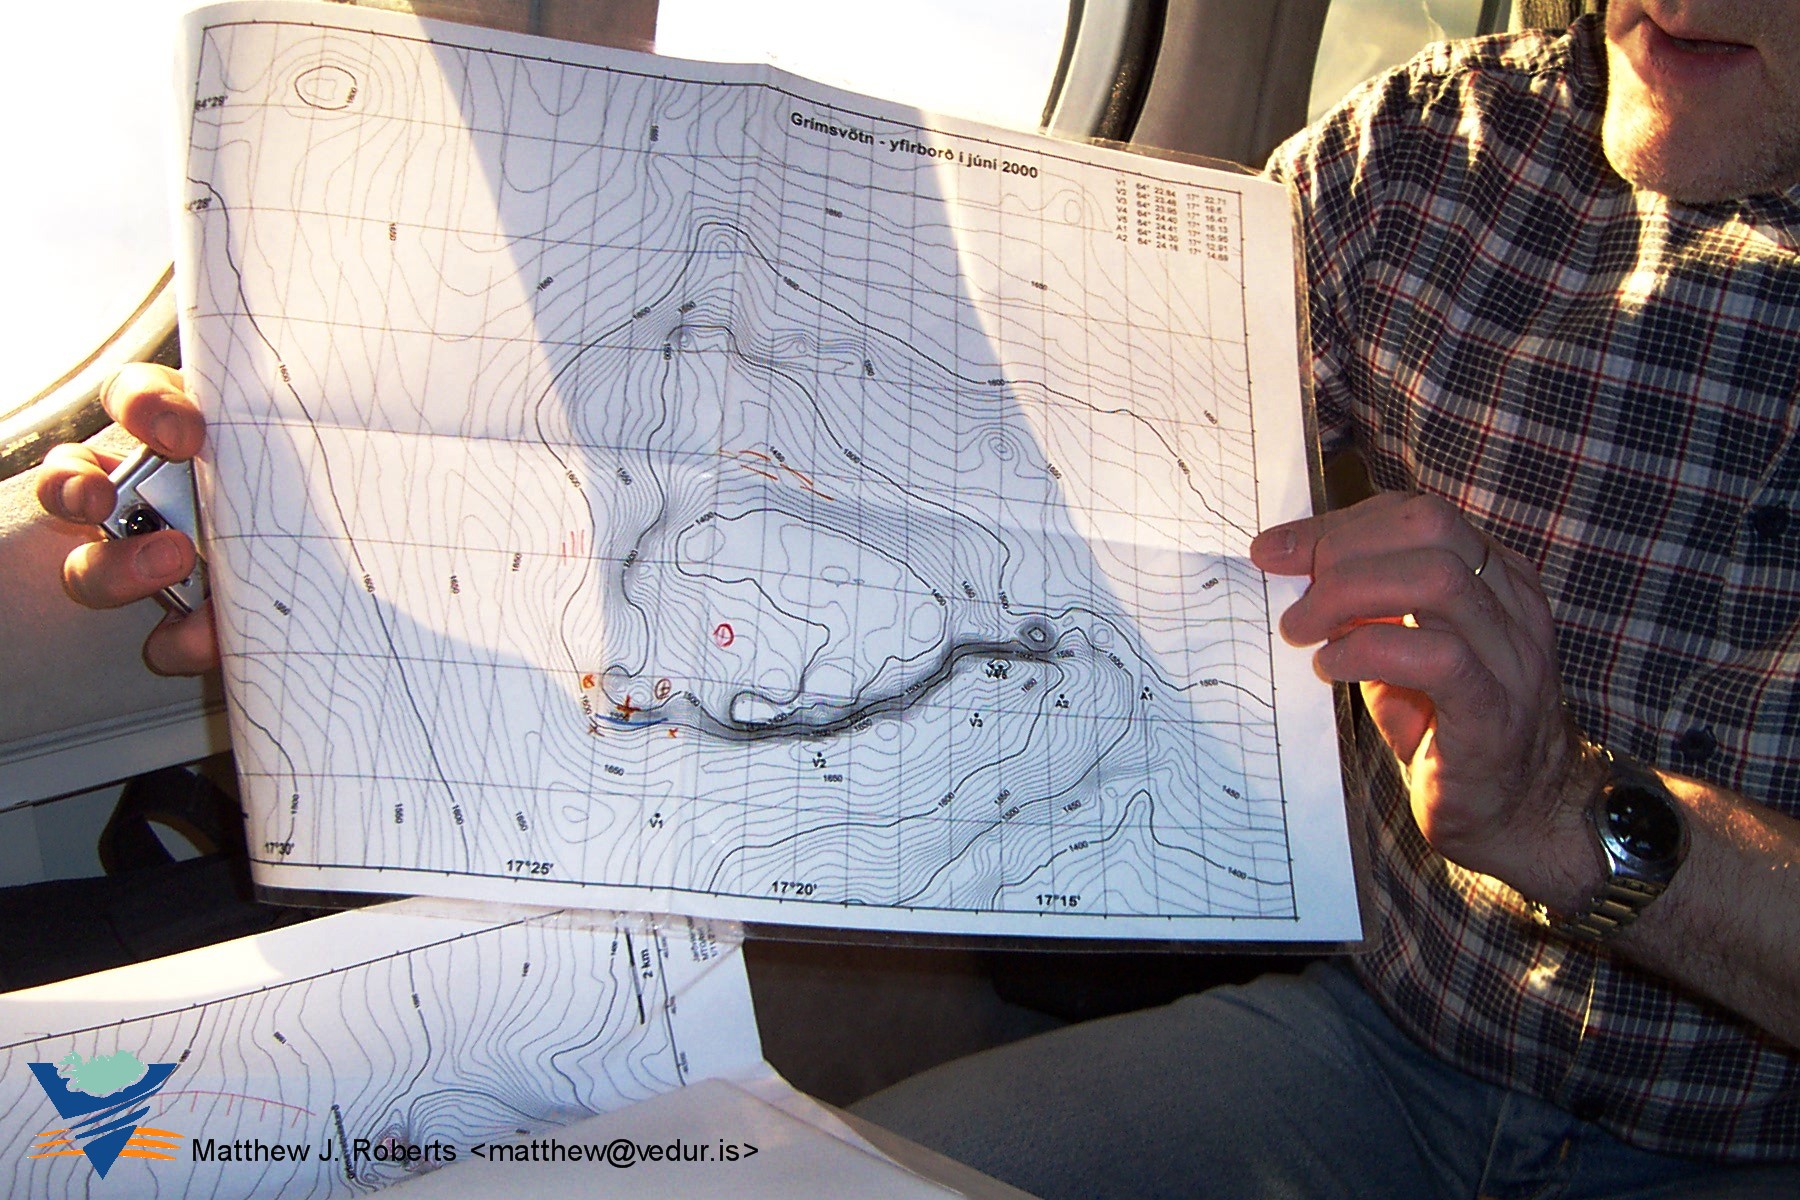
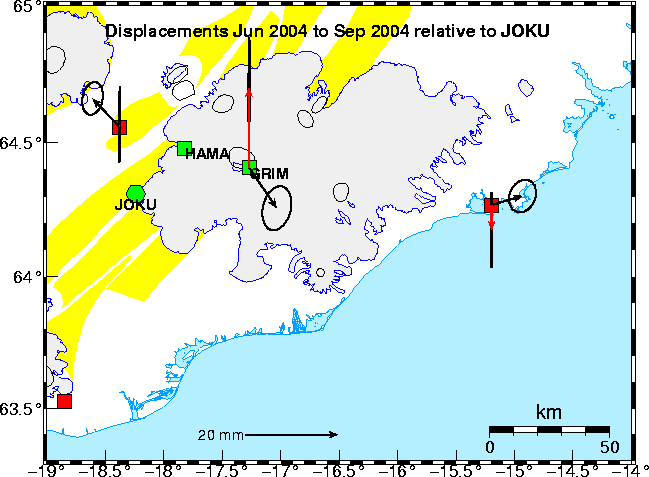
The Icelandic Glaciological Society makes research trips to Vatnajökull twice a year. At the end of September, GPS measurements were made on Grímsfjall (GRIM). The map shows displacements in the time period June to September 2004 relative to the station at Jökulheimar (JOKU). The black arrows with error ellipses denote the horizontal displacement and the red arrows the vertical displacement. GRIM was displaced by about 10.7 mm to the southeast, which is slightly lower than the displacement rate (mm/year) from spring 2003 to spring 2004. GRIM rose by about 17 mm during the time period June to September 2004, which is a slightly higher displacement rate than from spring 2003 to spring 2004 (Halldór Geirsson and Erik Sturkell).
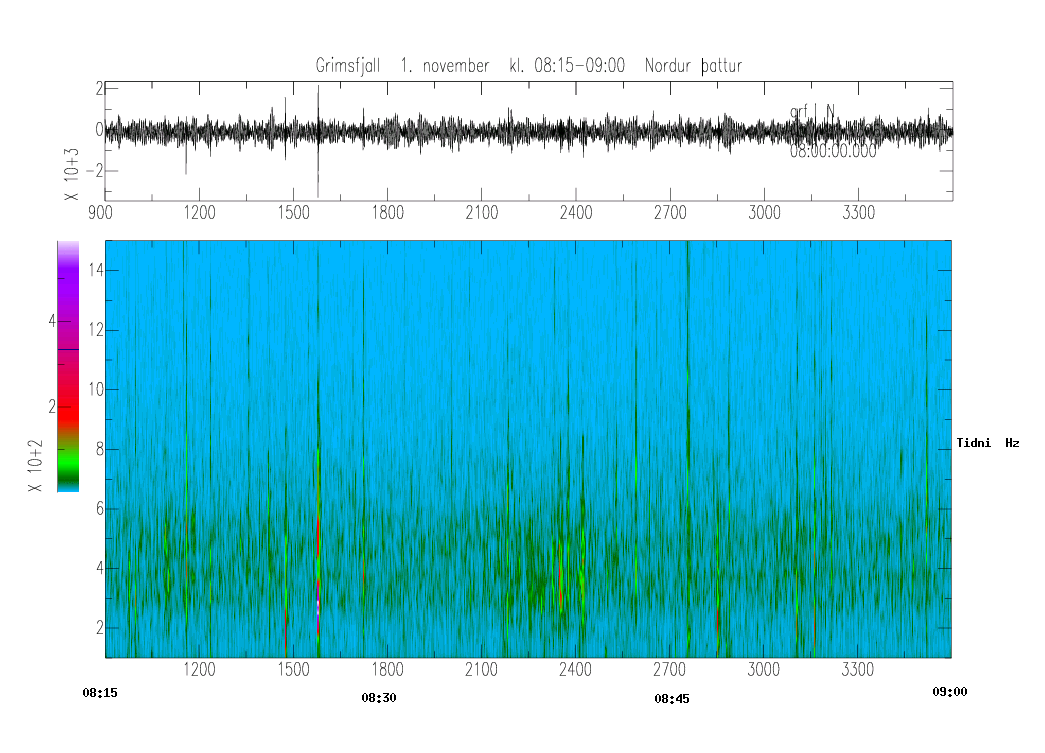
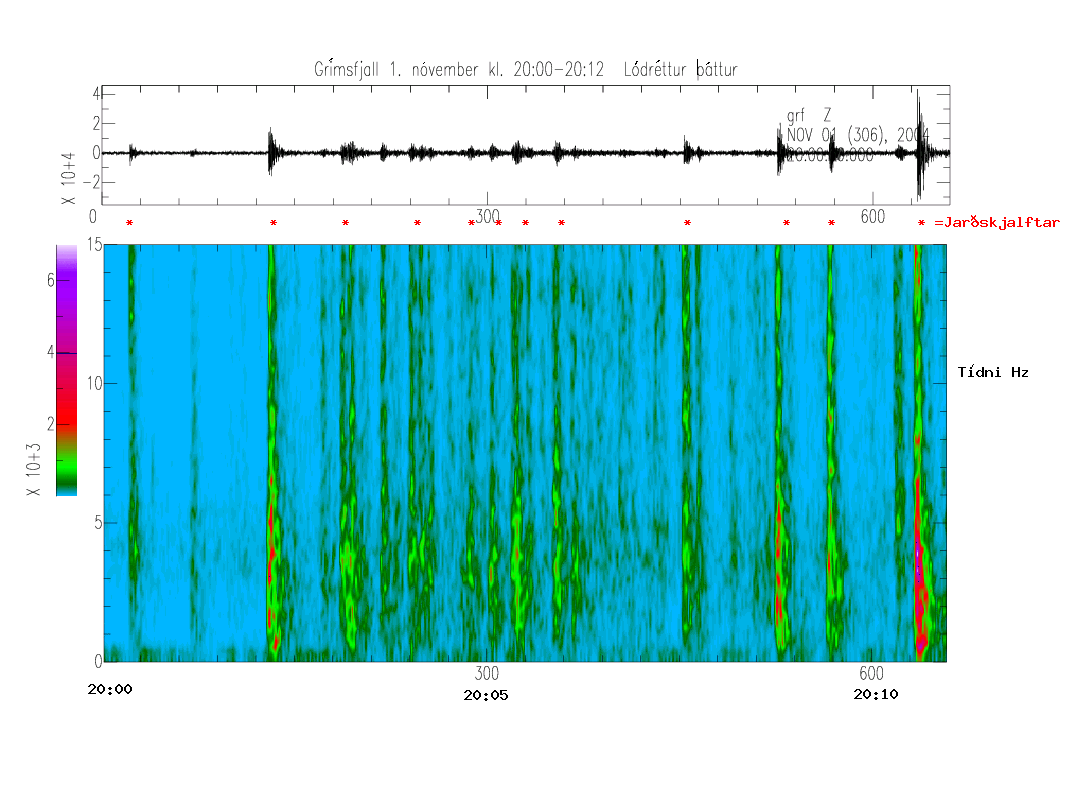
On Oct. 28 the seismic records from Kálfafell, south of the Vatnajökull ice sheet, showed signs that a jökulhlaup (glacial burst flood) was imminent. The jökulhlaup began early Saturday morning, Oct. 30, and the water level of Skeiđará River began to rise. On the morning of Nov. 1 jökulhlaup tremor was observed on the seismic records at the Grímsfjall station, with energy mainly in the frequency band 2 - 6 Hz. The above figure is a frequency spectrogram of the vertical component in the time window 08:15 to 09:00 on Nov. 1. No sign of volcanic tremor can yet be seen.
In the early morning of Monday Nov. 1, an earthquake swarm began beneath Grímsvötn. 12 earthquakes could be located till 14:00, the largest occurring at 06:51 with magnitude 3. The next earthquake that was possible to locate occurred at 19:30. 6 events could be located in the next 40 minutes, but at 20:10 earthquake magnitudes increased and the swarm intensified.
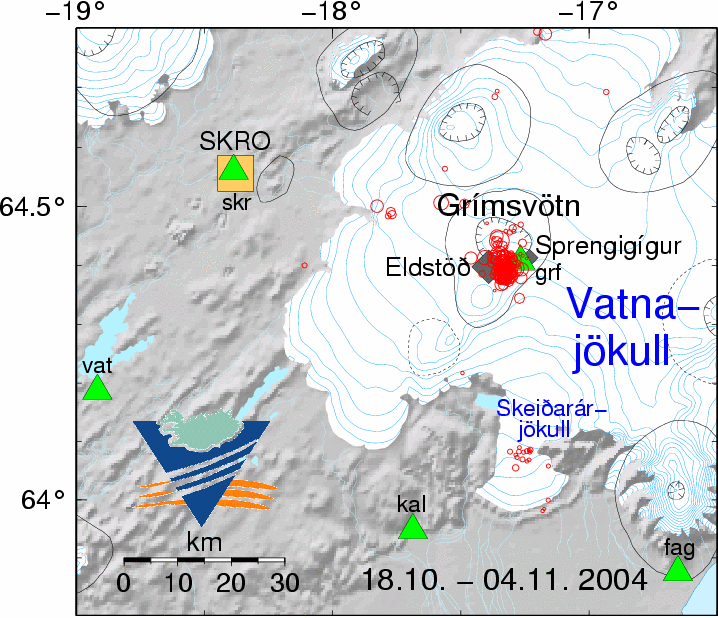
The above map shows earthquake epicenters (red circles) in Vatnajökull from Oct. 18 to Nov. 1, 2004. A preliminary location of the eruption site is shown as a dark diamond. Seismic stations are denoted by green triangles and a continuous GPS station by a yellow square.
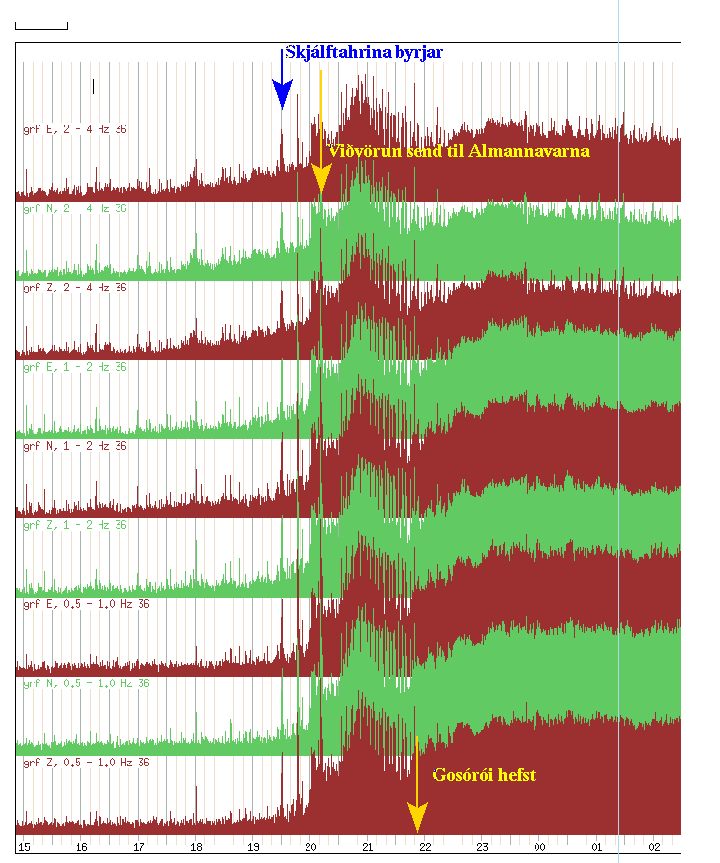
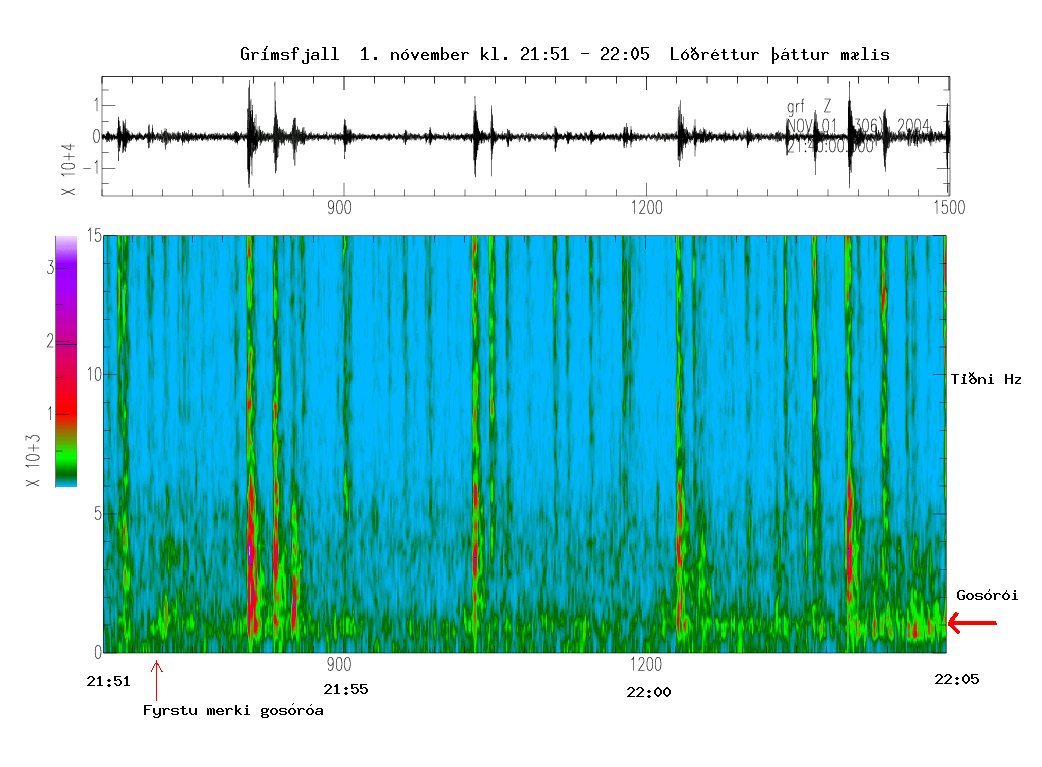
An eruption warning was sent to the Civil Defence at 20:10, Nov. 1. The intensified seismic activity at 20:10 is obvious on the tremor plot from Grímsfjall shown above. The amplitude is shown in three different frequency bands. A magnitude 3 earthquake occured at 20:11. This earthquake and the extreme density of earthquakes can be seen on the frequency spectrogram from the Grímsfjall station shown below. During the next two hours about 160 earthquakes were recorded with magnitudes up to 2.8.
Volcanic tremor was first observed after a magnitude 2.7 earthquake occurred at 21:50. The frequency of the tremor energy is concentrated around 1 Hz. The intensity of the tremor increased in the next hours. See figure below.
The volcanic tremor was continuous throughout the night. An increase in power
between 4 and 5 hours (Nov. 2) was observed. From radar images it can be seen
that the eruption plume increased in size at this time. Below is a tremor plot
from the station Grímsfjall. The vertical component is shown in 3 frequency
bands. The data is filtered with a median filter.
From here you can view tremor plots from all our seismic stations. Note that the volcanic tremor is recorded at great distances from the eruption site.
Radar images from the Meteorological Office of Iceland of the eruption plume at the beginning of the Grimsvotn eruption, Nov. 2004.
 |
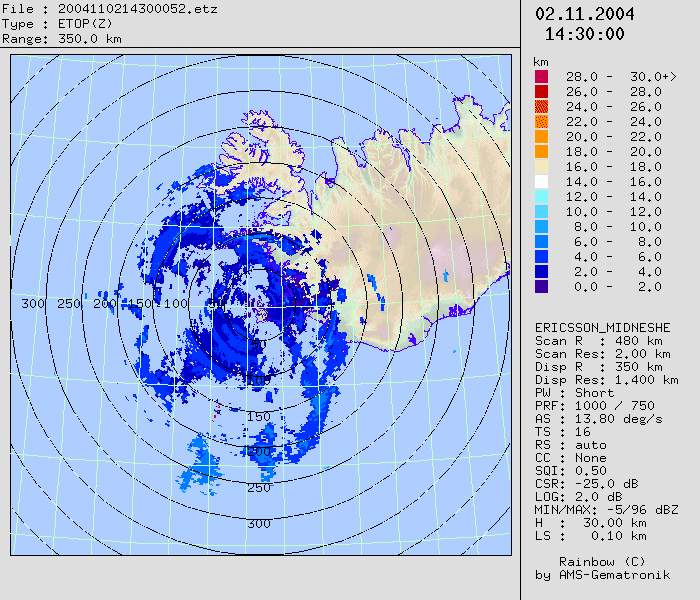 |
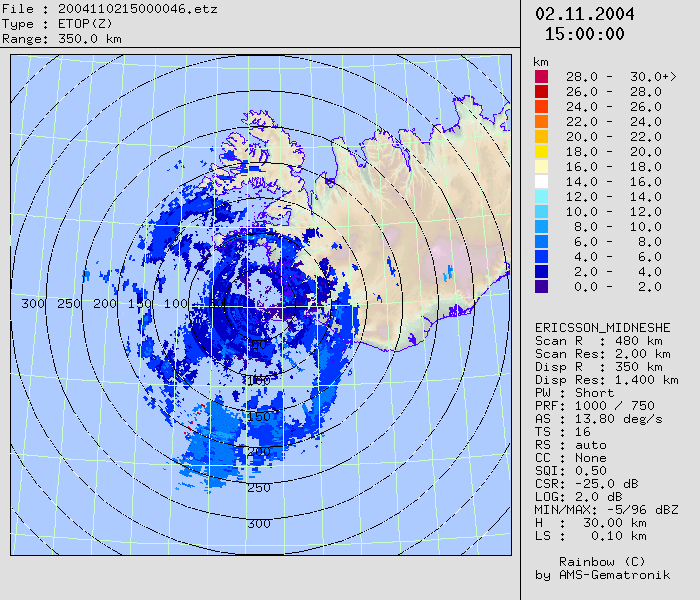
Radar images of the plume on November 2nd. The image to the left above at 15:00 shows two separate plumes. The iimage to the right is a movie showing snap shots at 5 min. intervals, covering the time window between 14:30 and 15:30.
Satellite images from Switzerland of the eruption plume
Satellite images from NASA of the ash plume
 |
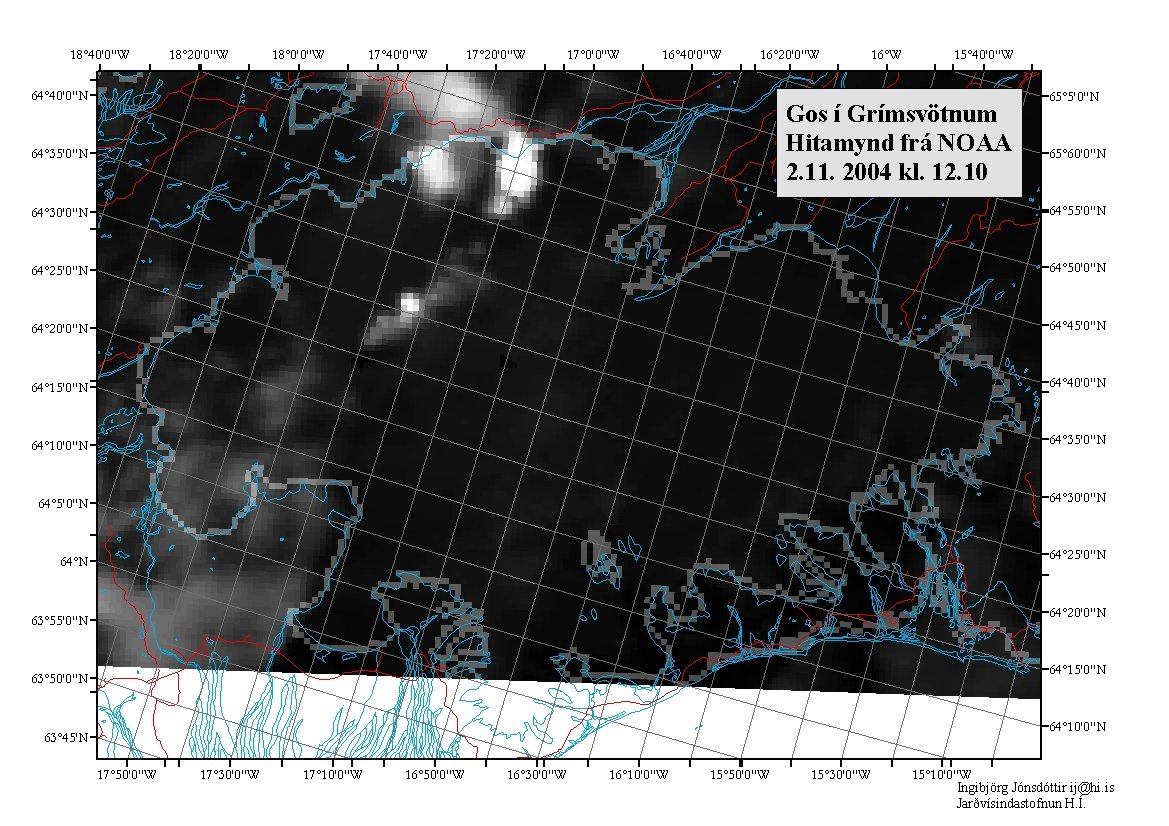 |
The image to the left above is a Modis image from Nov. 2, 2004 and the image to the right is a Thermal Infra-red image from Nov. 2, 2004 from NOAA
The variation in the eruption energy seen in the volcanic tremor above, on the morning of November 3, is also apparent in the spectrograms from that period. Below, a spectrogram for the time window 09:20 to 10:00 is plotted. It shows the volcanic tremor vanishing for approximately 7 minutes around 09:40.

Here you can see the number of lightning in the eruption plume.
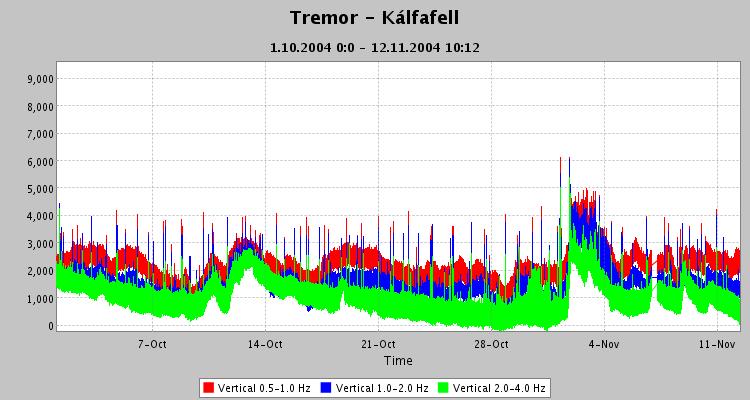
At the end of week 45 (Nov. 1-7), the tremor at the station Kálfafell (kal) had returned to the same value as prior to the eruption. This can be seen in the figure above.
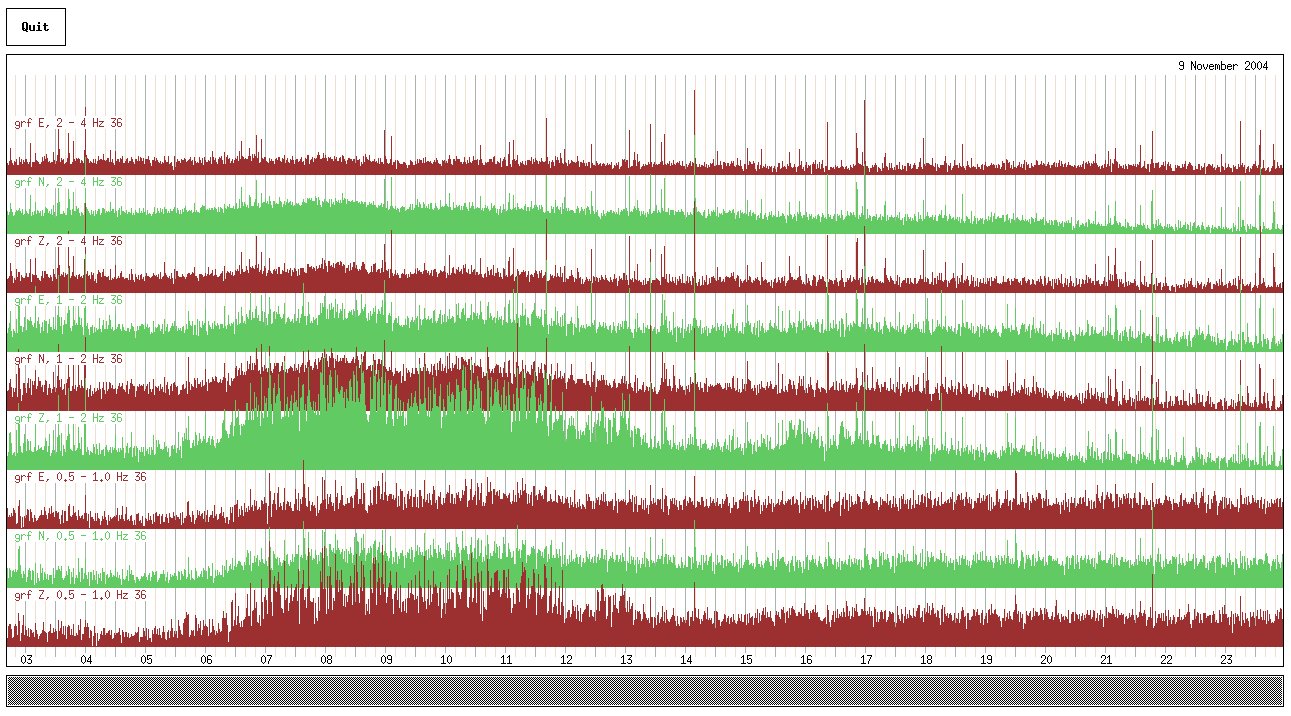
On Tuesday, Nov. 9, at 06:30 to 13:30, a tremor pulse was recorded at the station Grímsfjall (grf), see above figure.
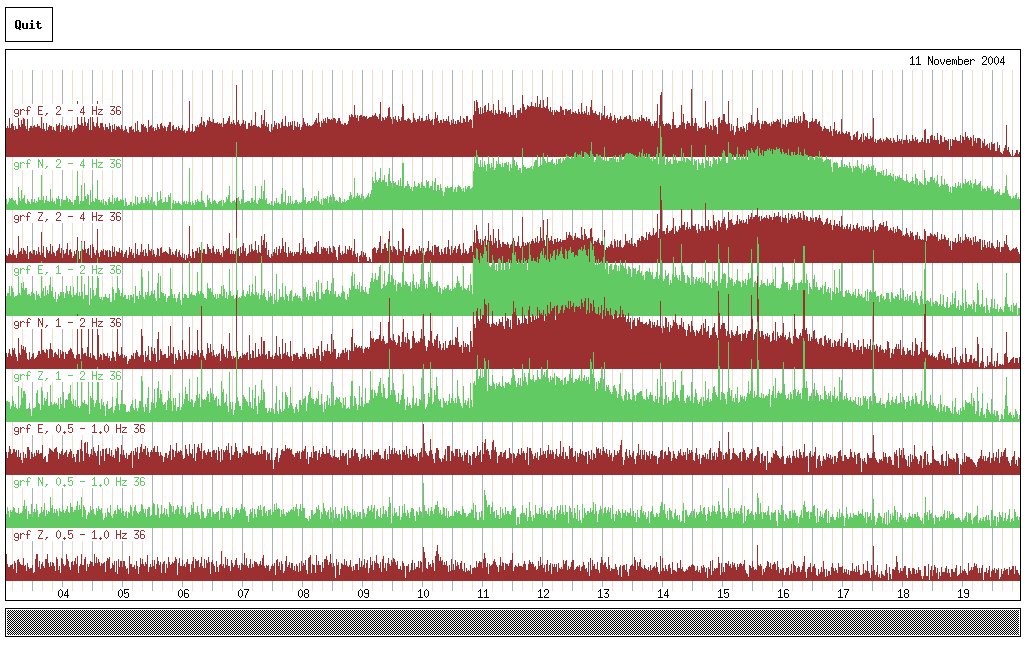
In the morning of Nov. 11 the station at Grímsfjall showed signs of increased jökulhlaup tremor, at a little past 09:00 and again around 11:00, as can be seen on the figure above.
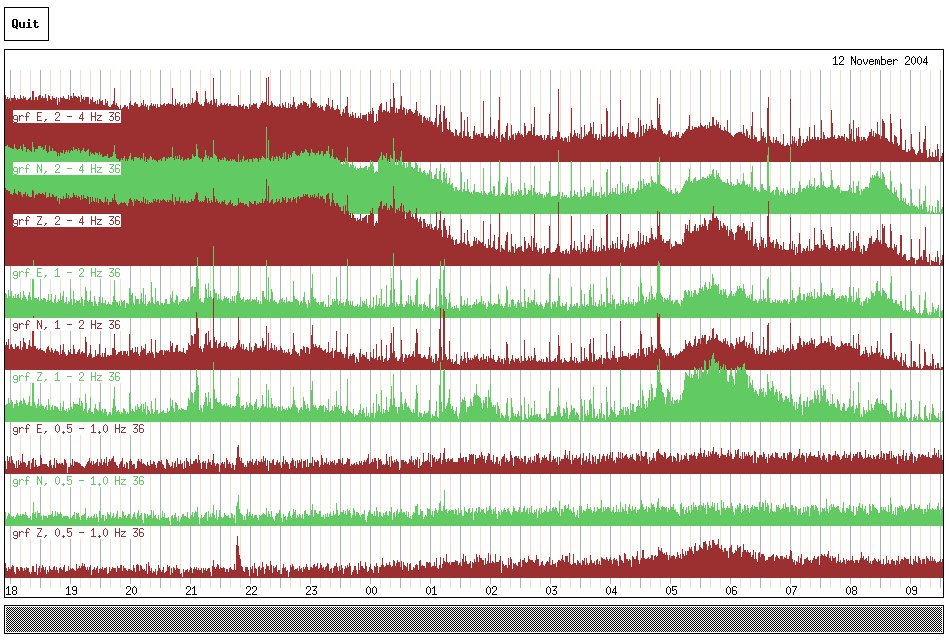
The tremor at Grímsfjall decreased after midnight on Nov. 12, but increased from 05:00 to 08:30, before decreasing again. The figure above shows the tremor plots from Grímsfjall. On Nov. 6 similar pulses were observed (see e-mail from Matthew Roberts).
Here is the latest radar image, updated every 5 minutes.
 |
 |
End of the volcanic eruption.
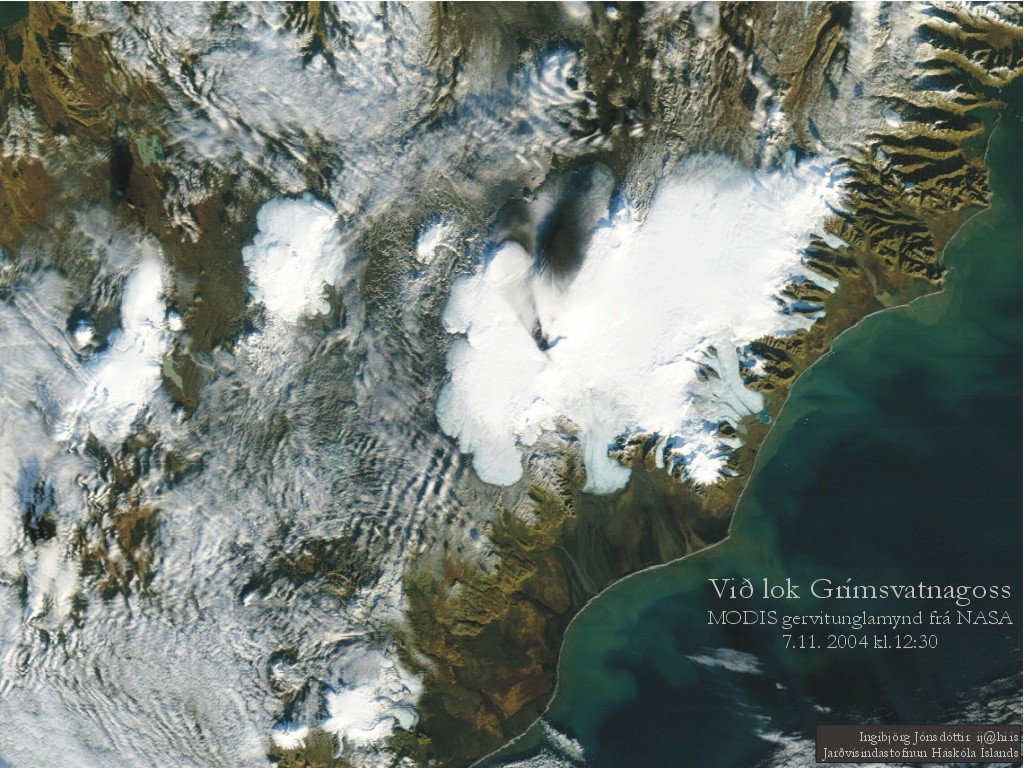
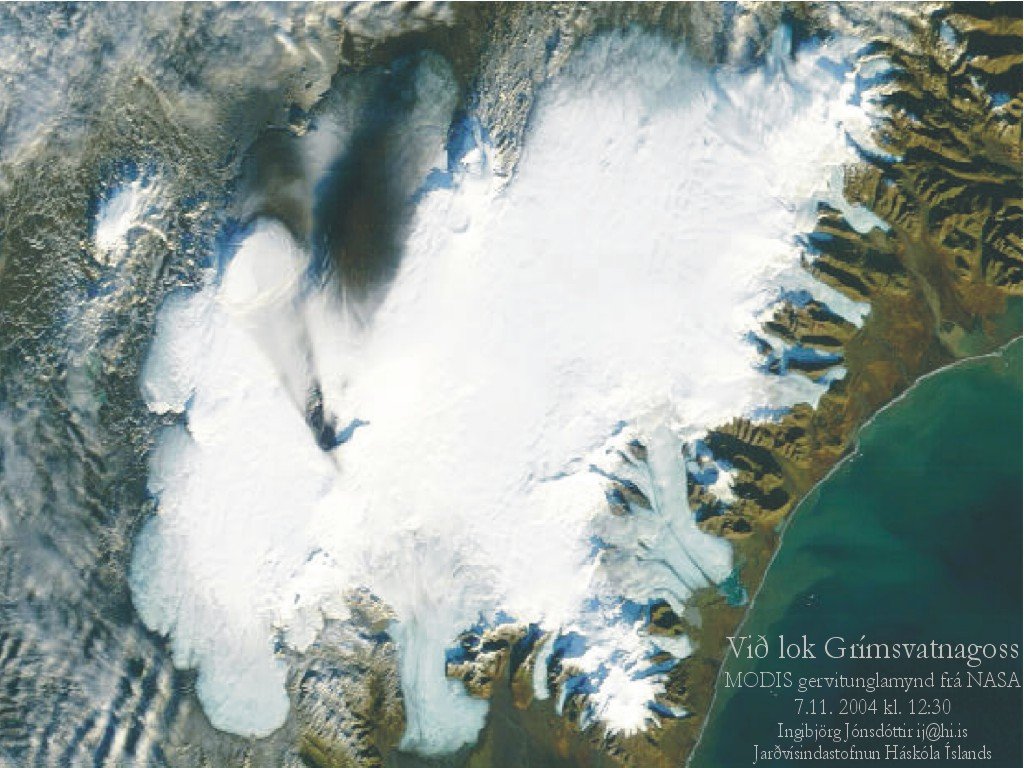
MODIS sattelite images from NASA (7. nov. 2004, 12:30)
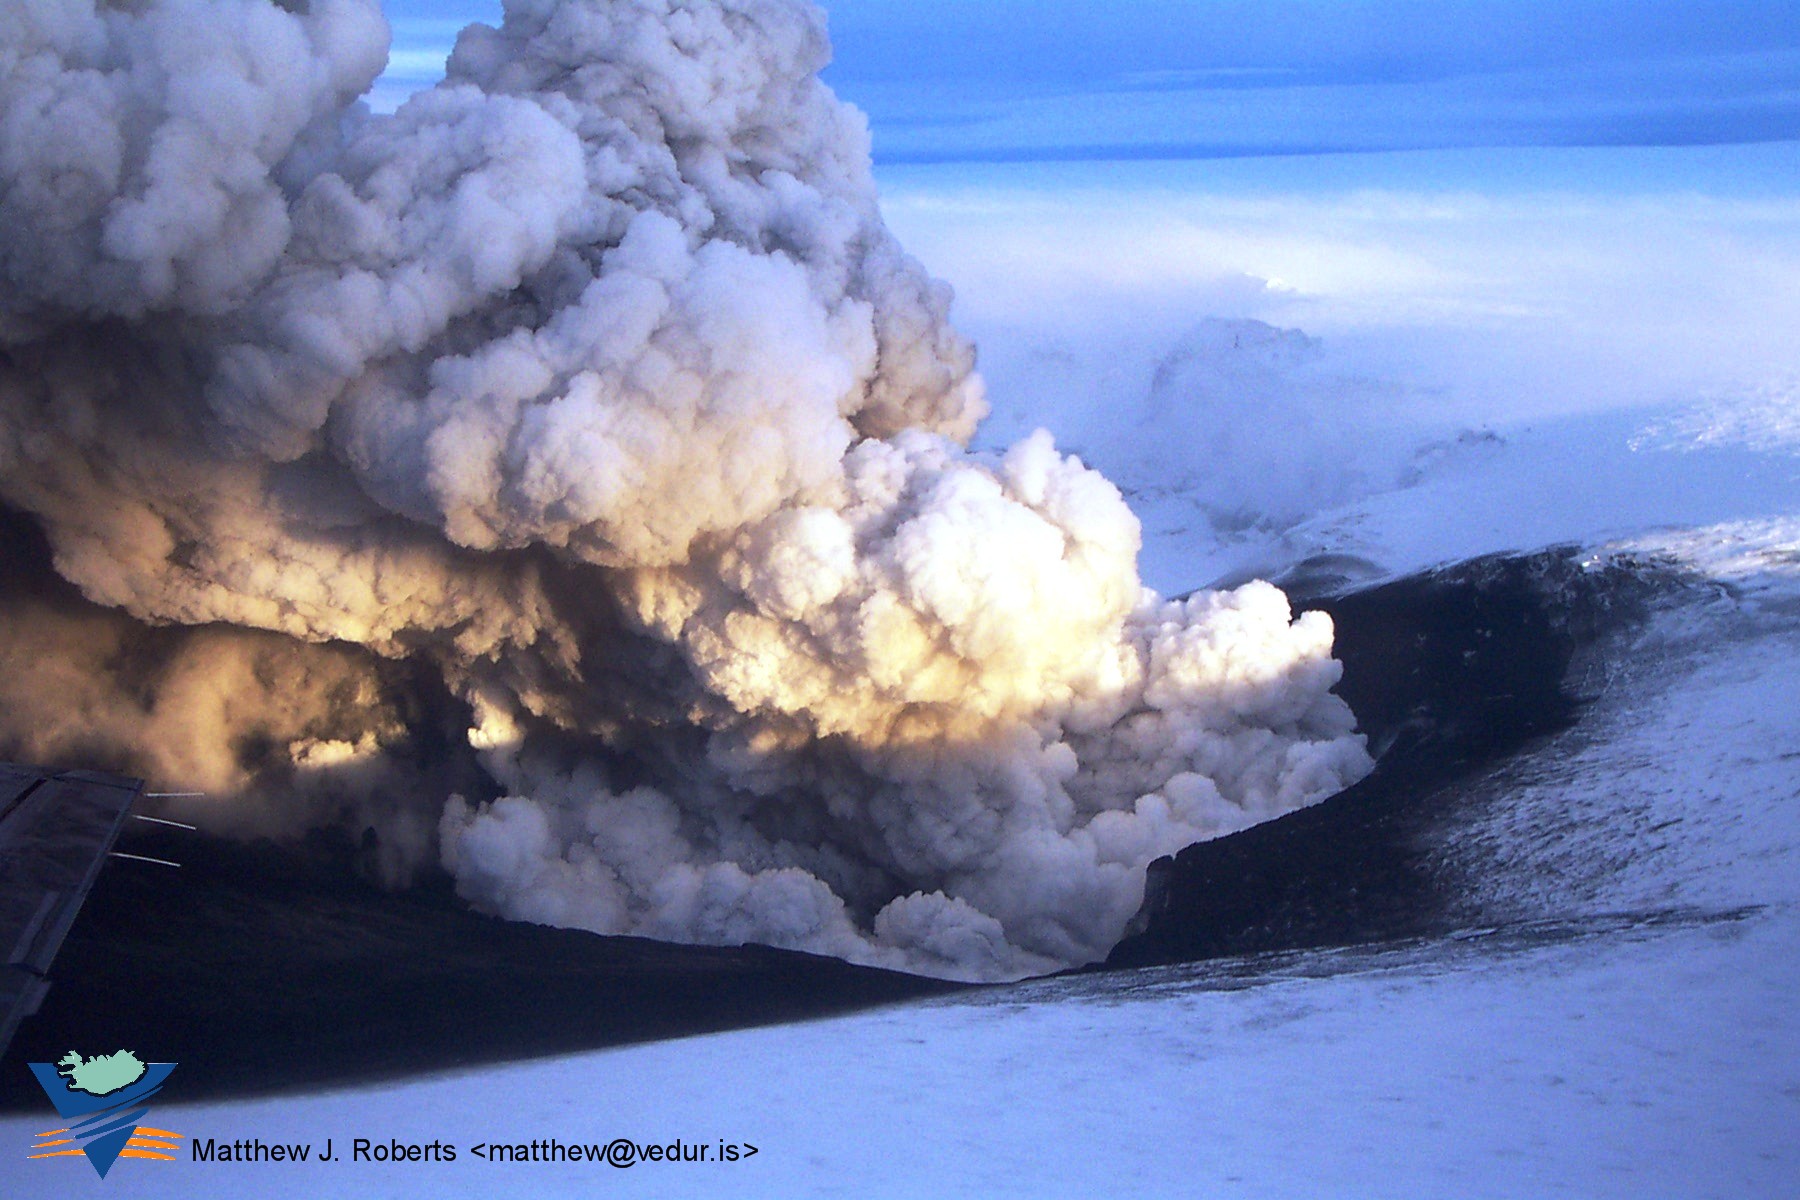
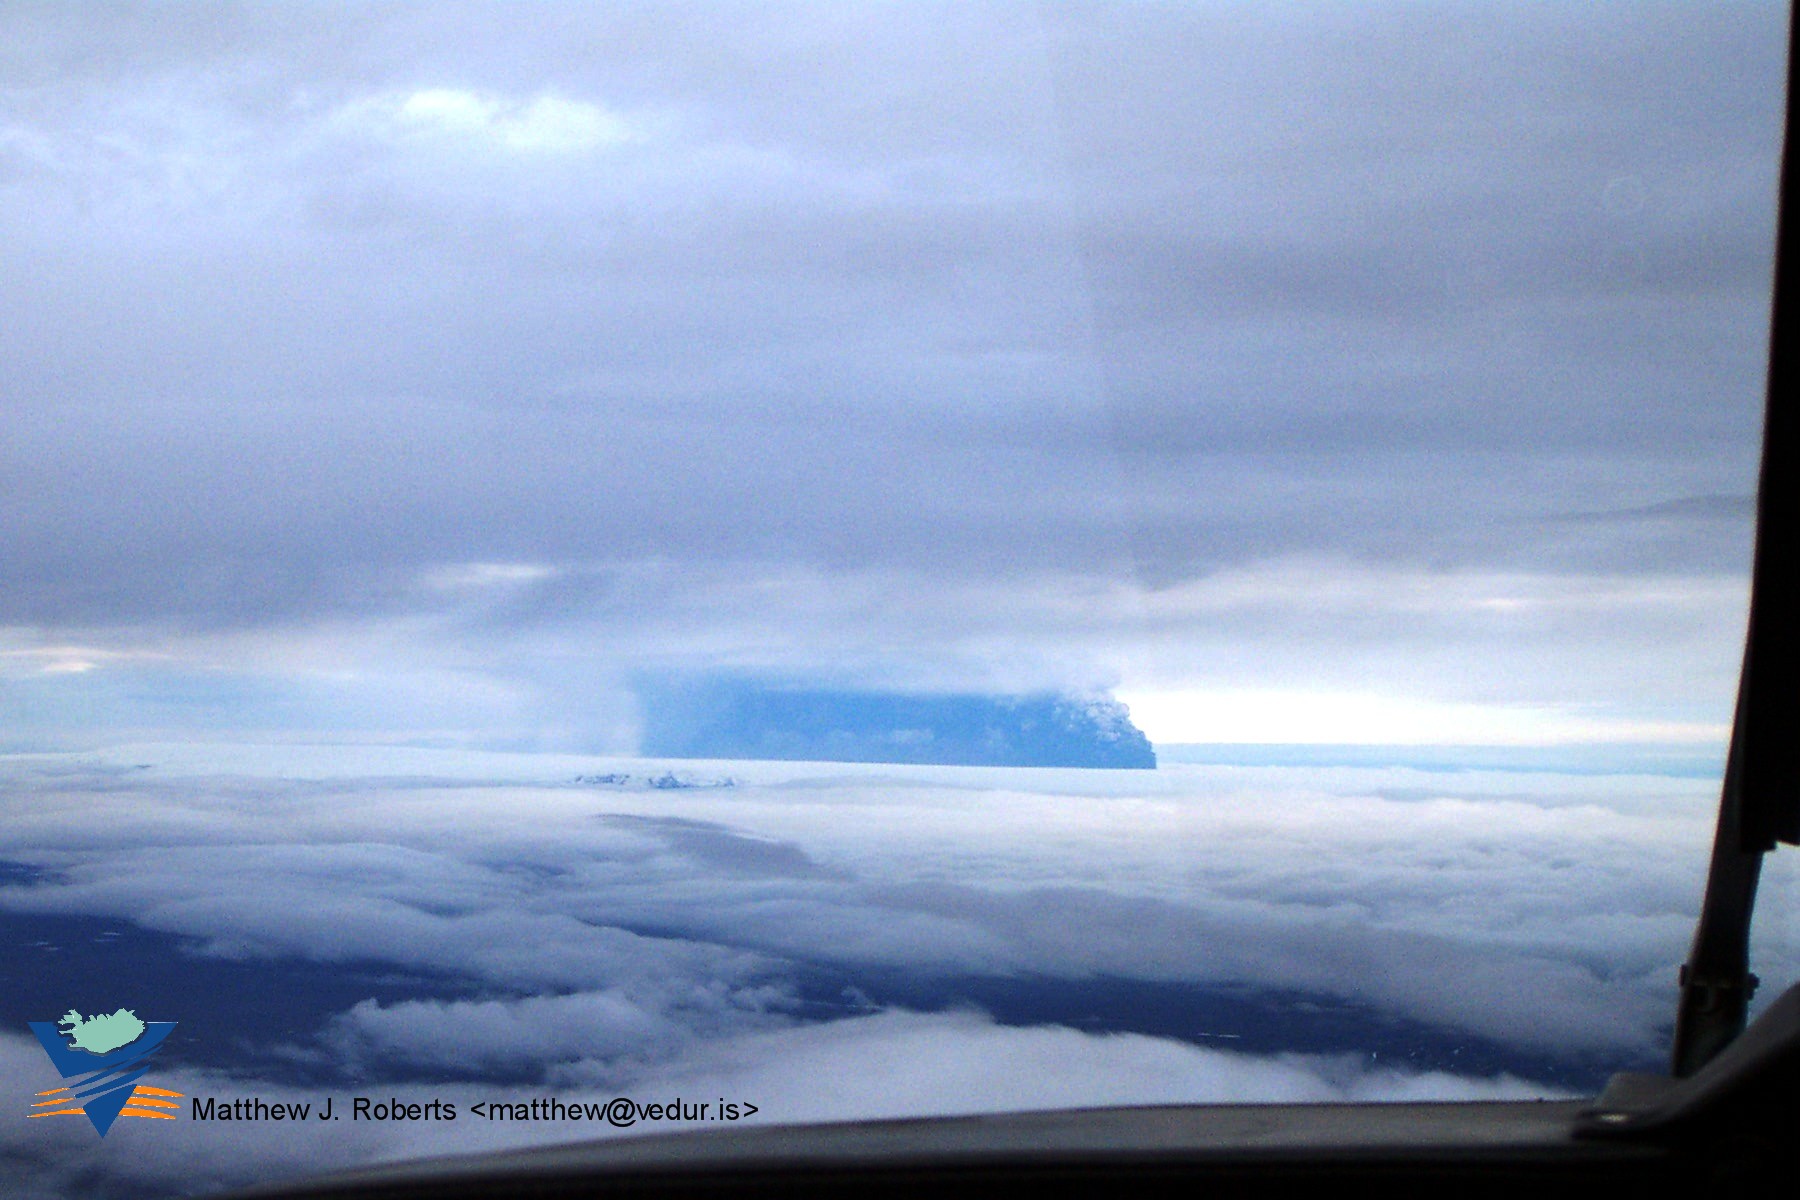
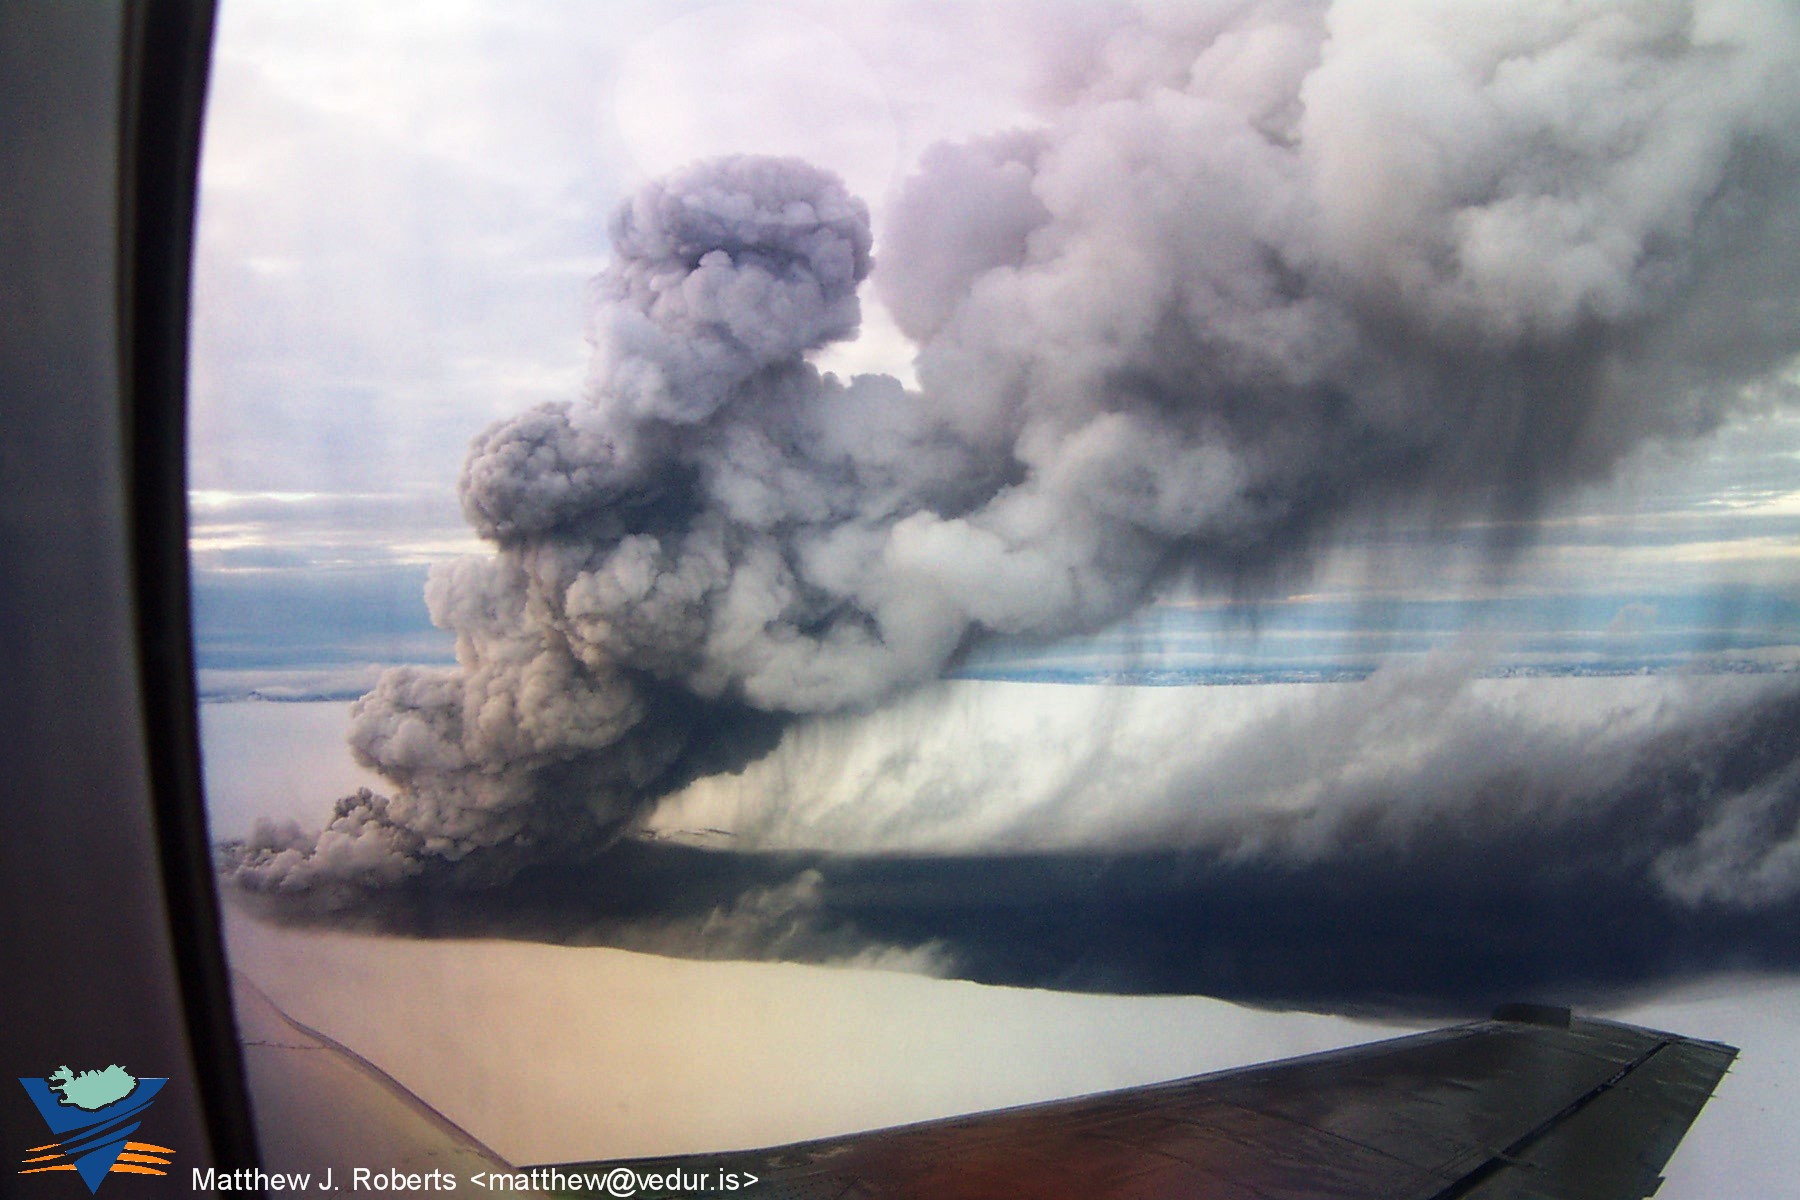
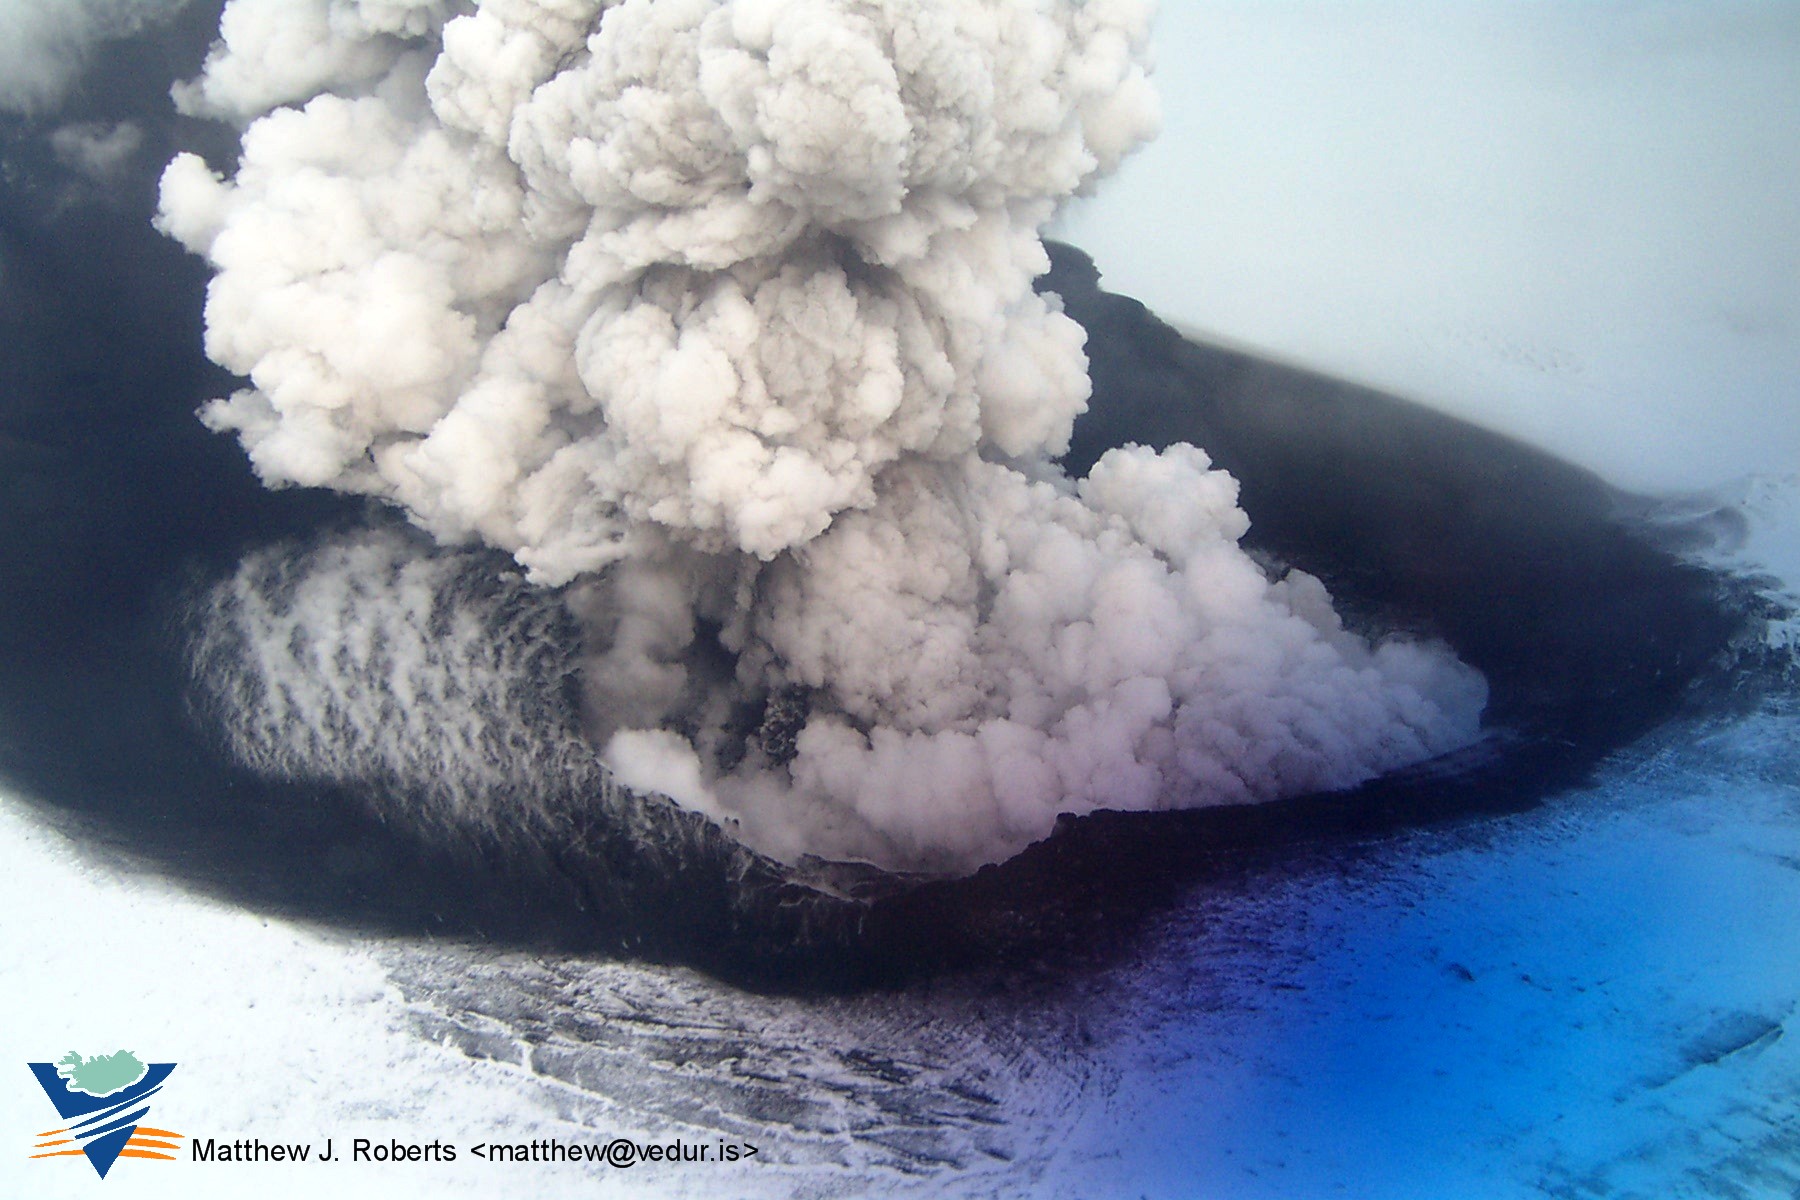
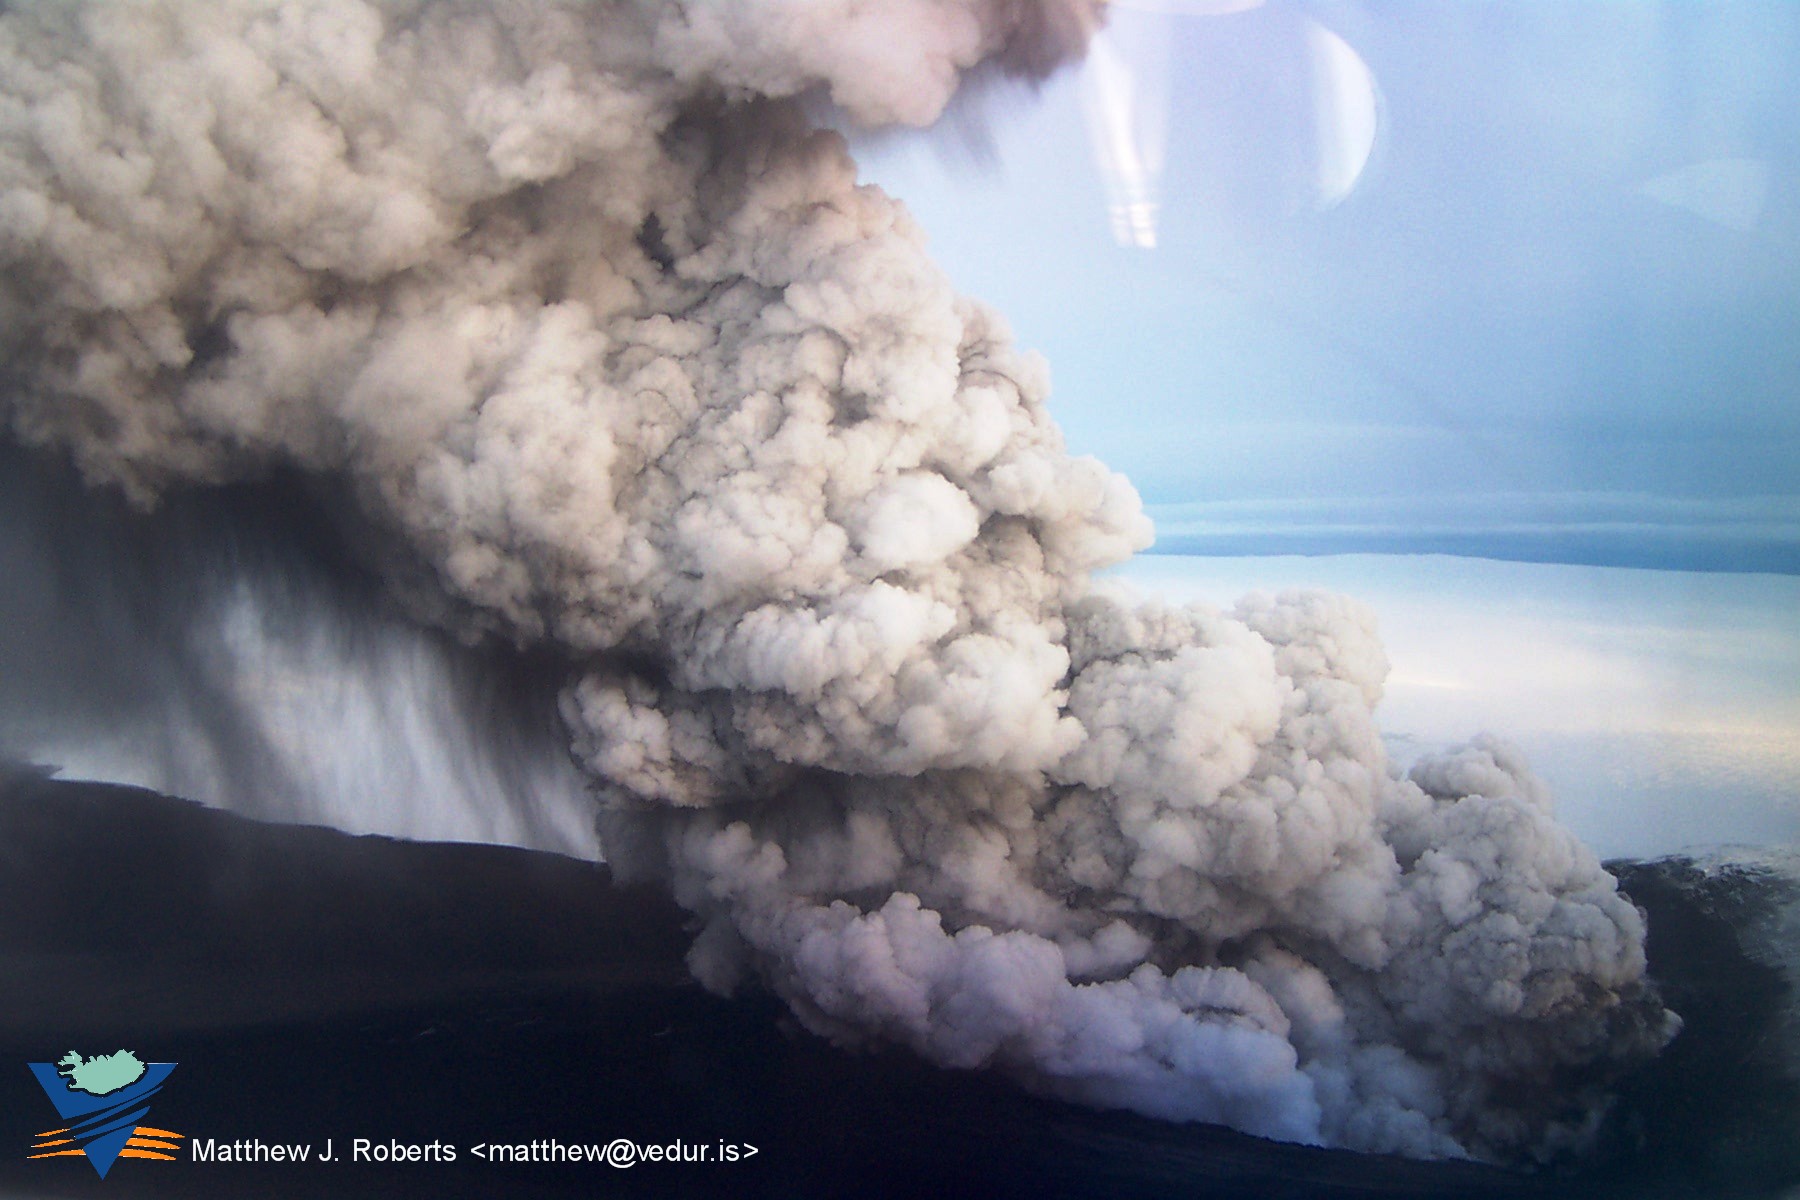
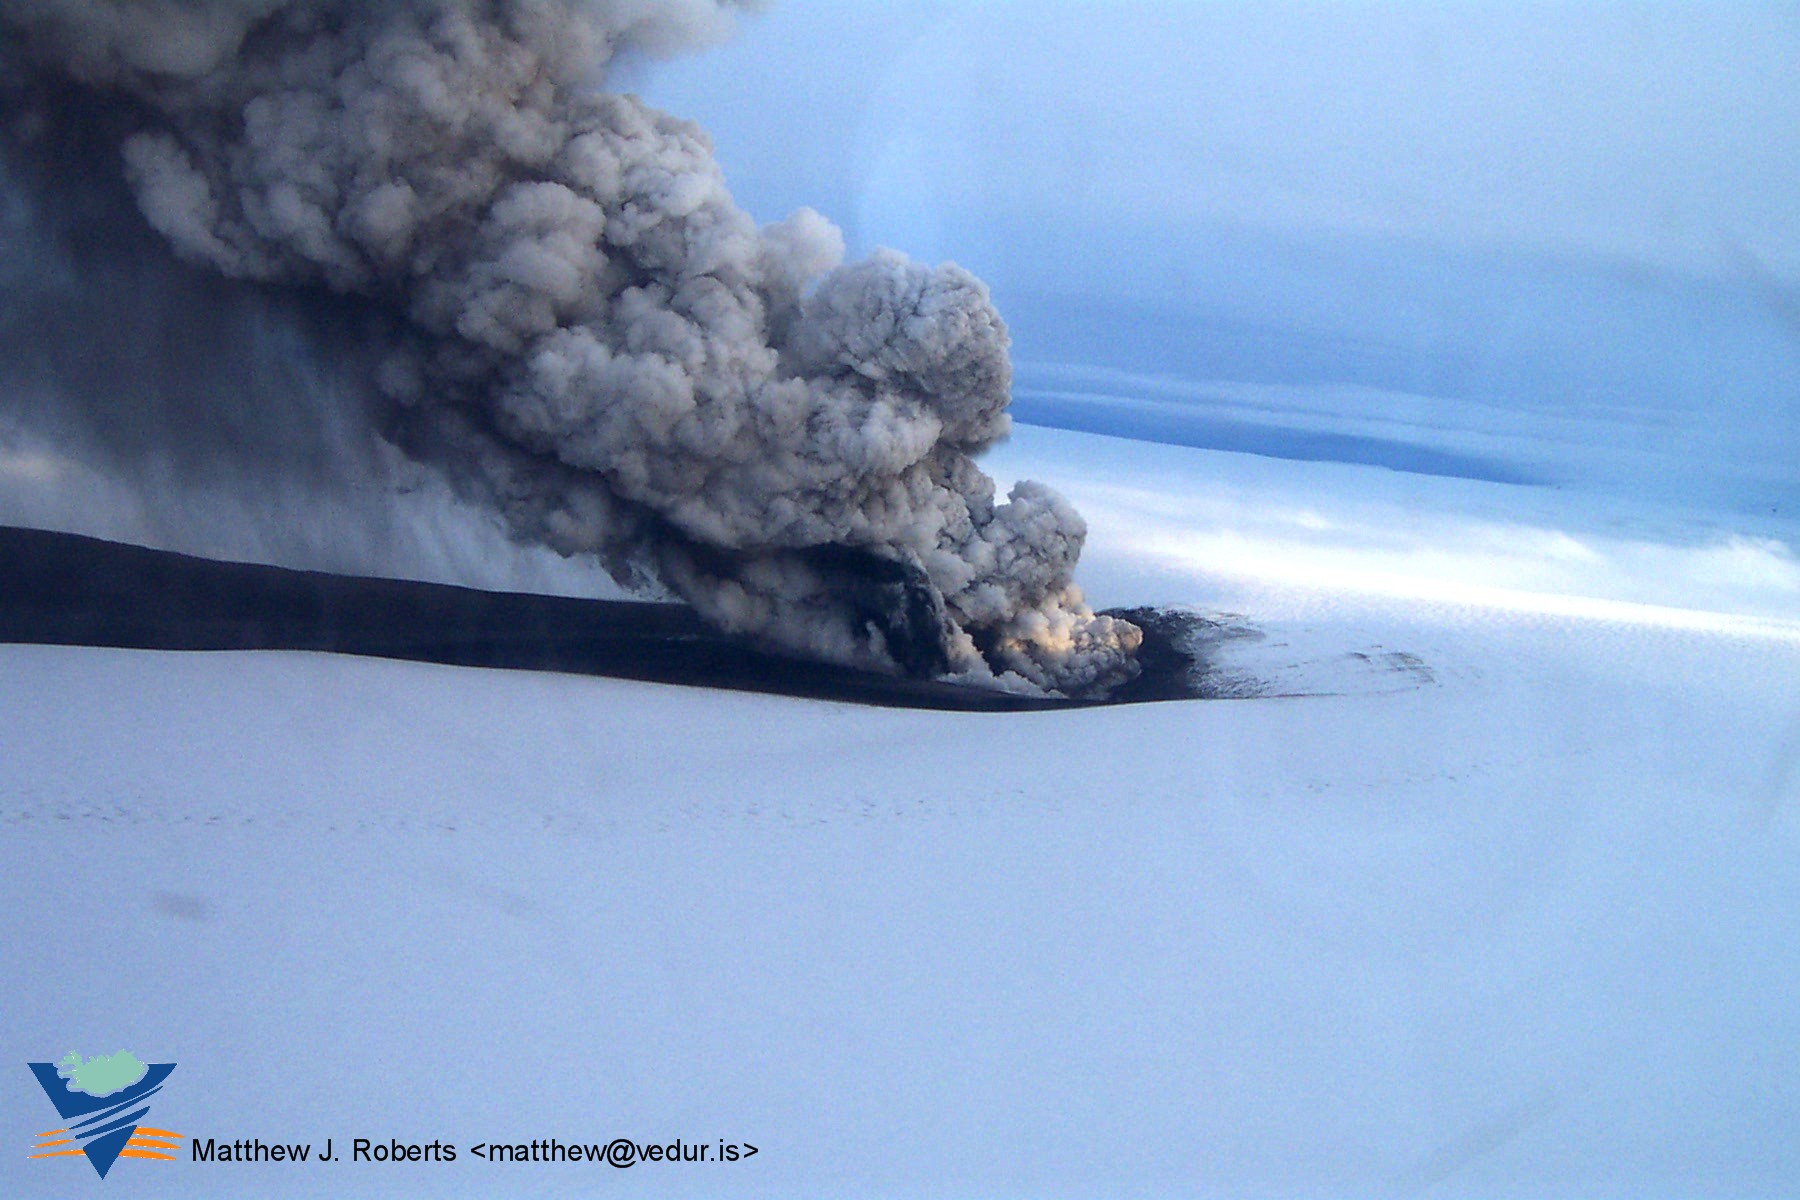
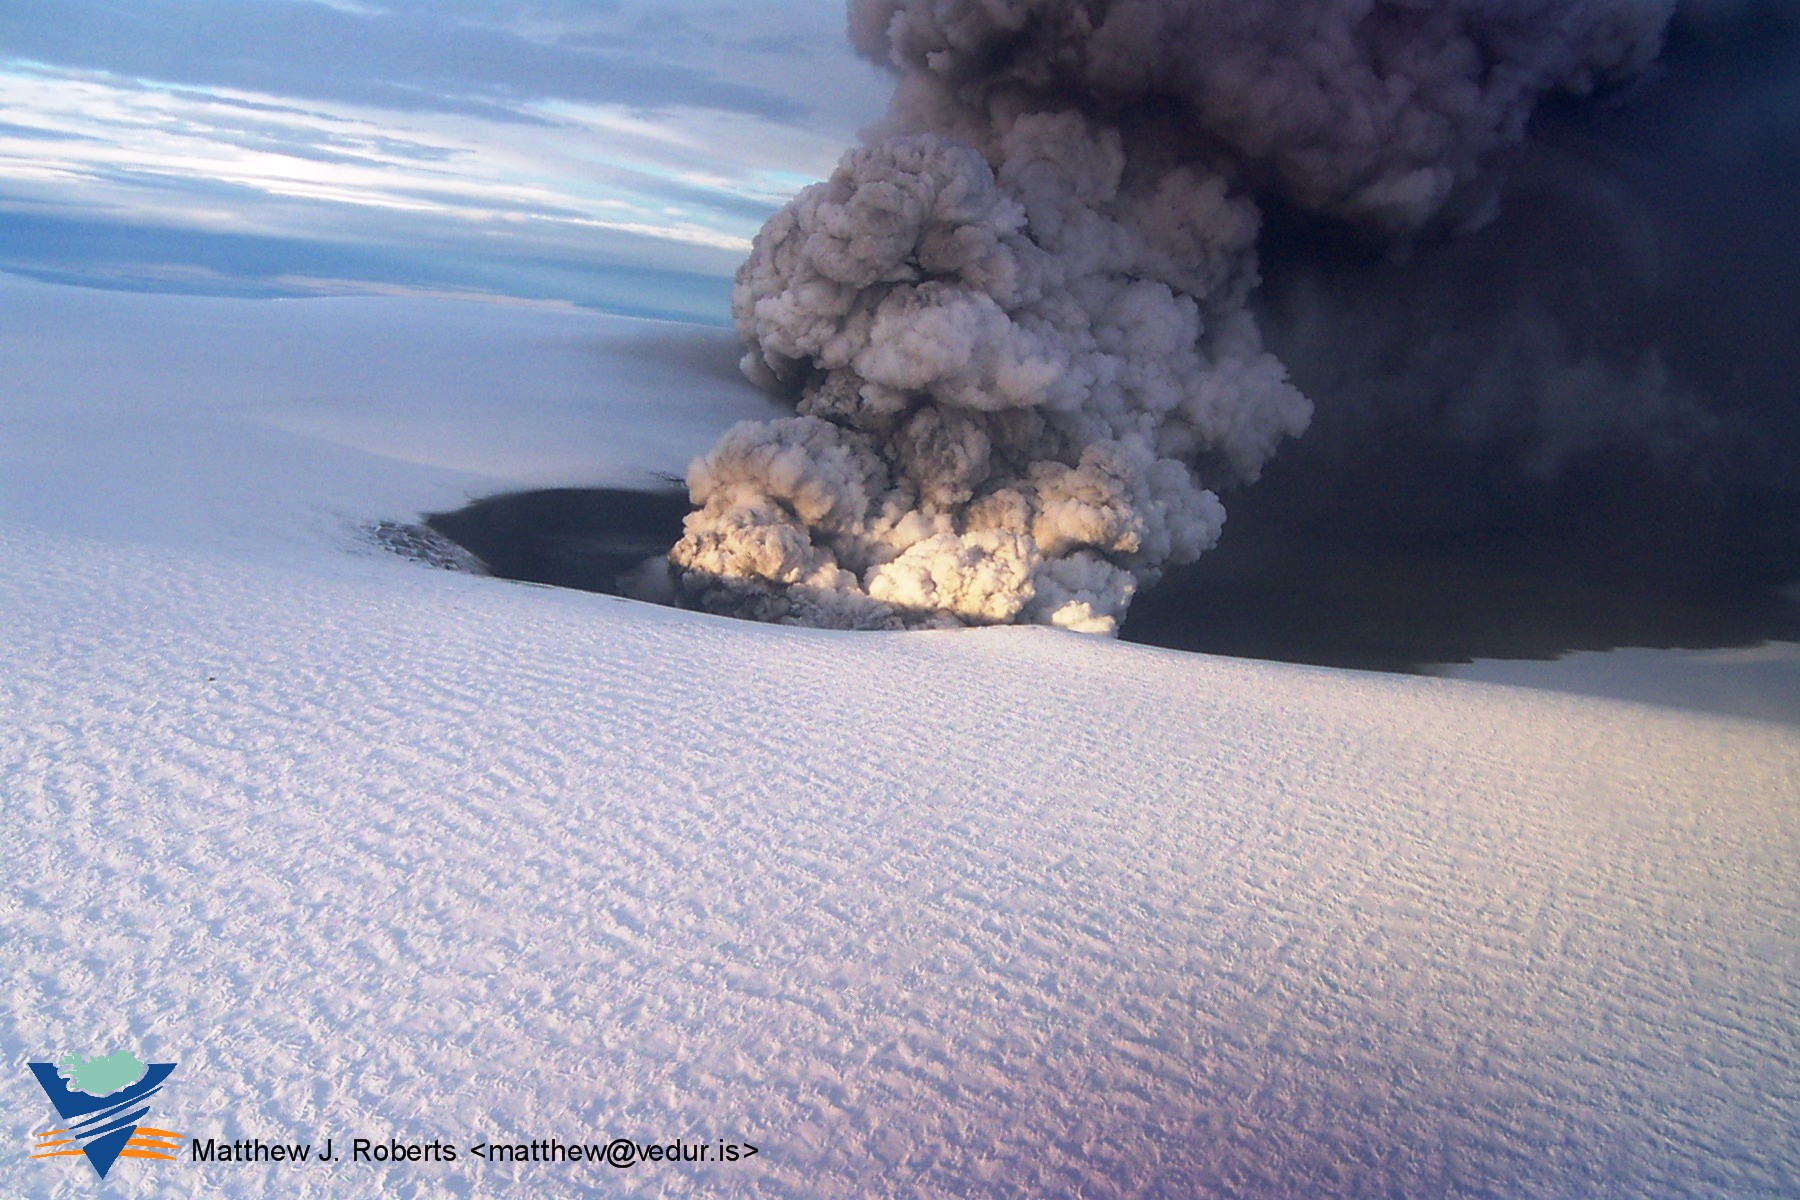
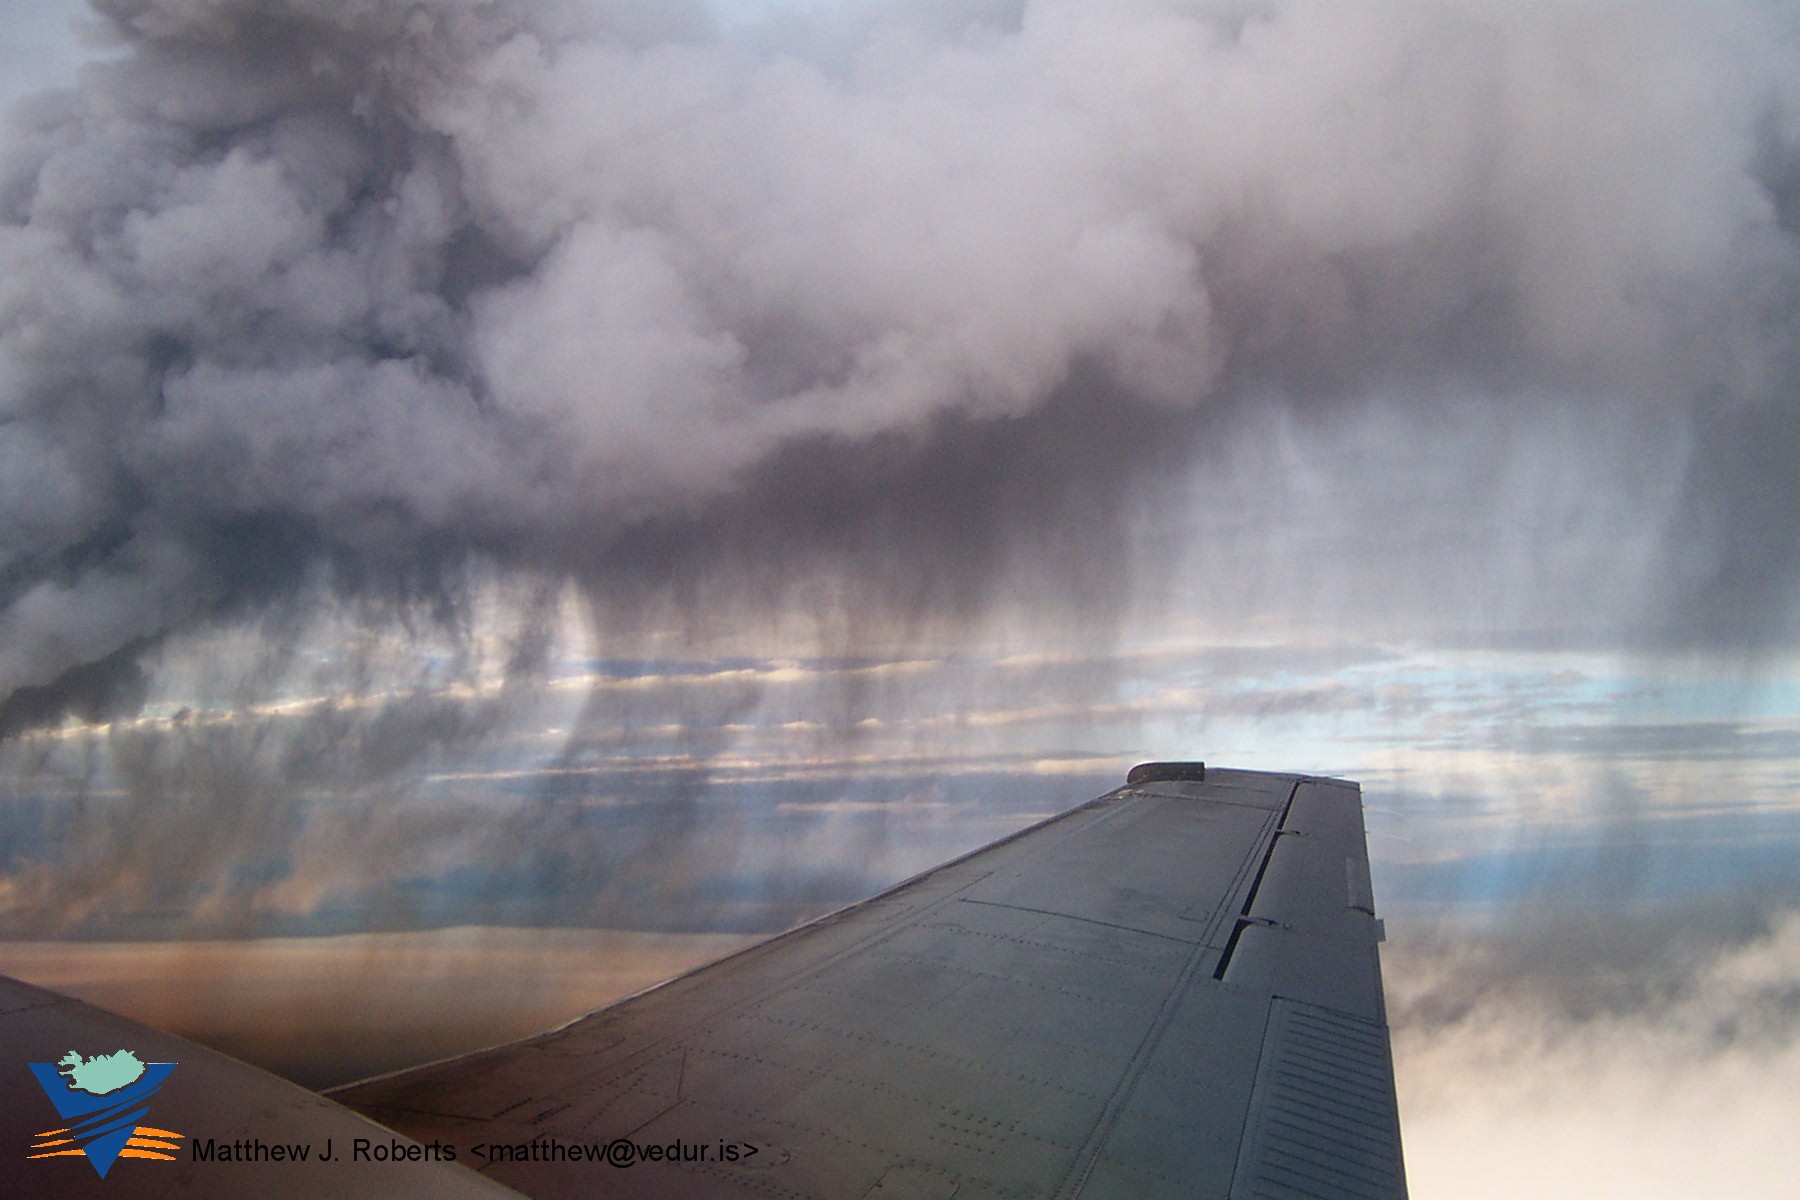
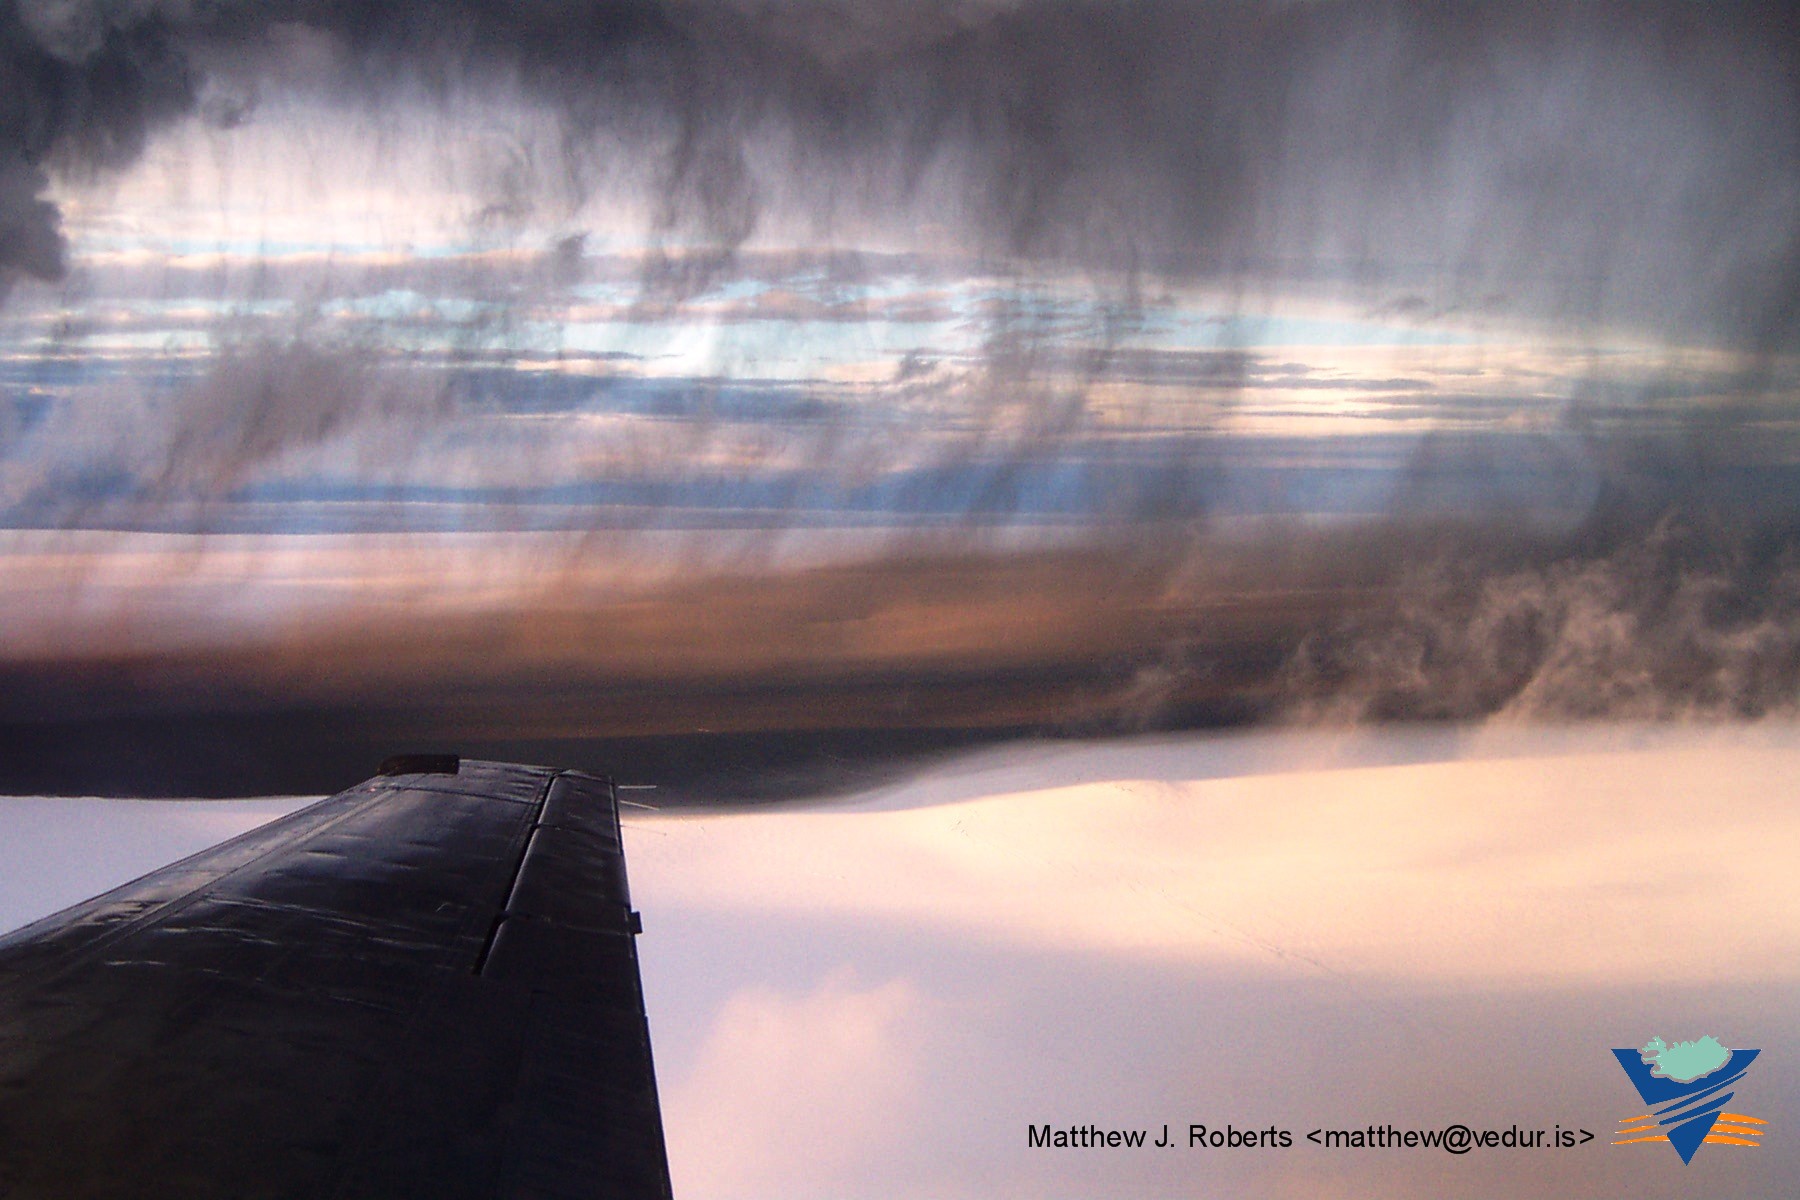
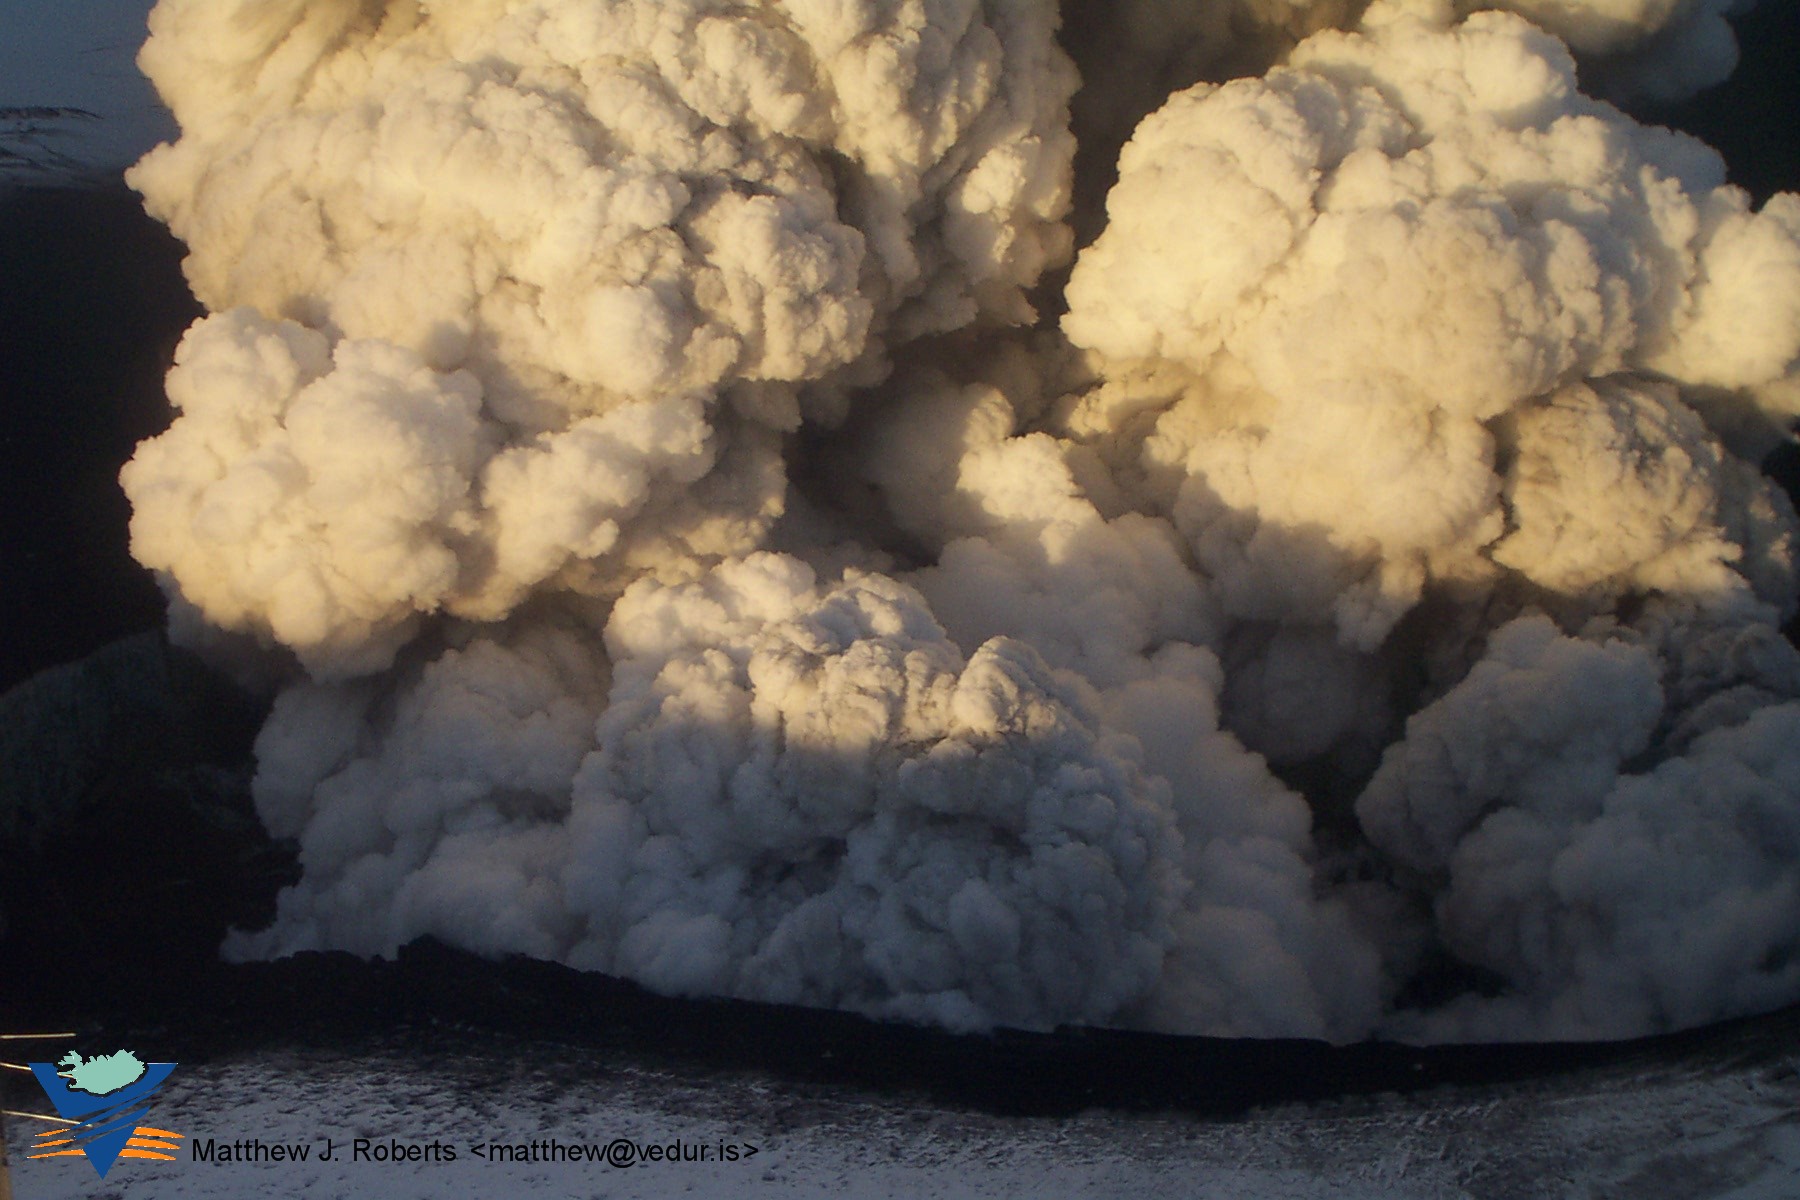
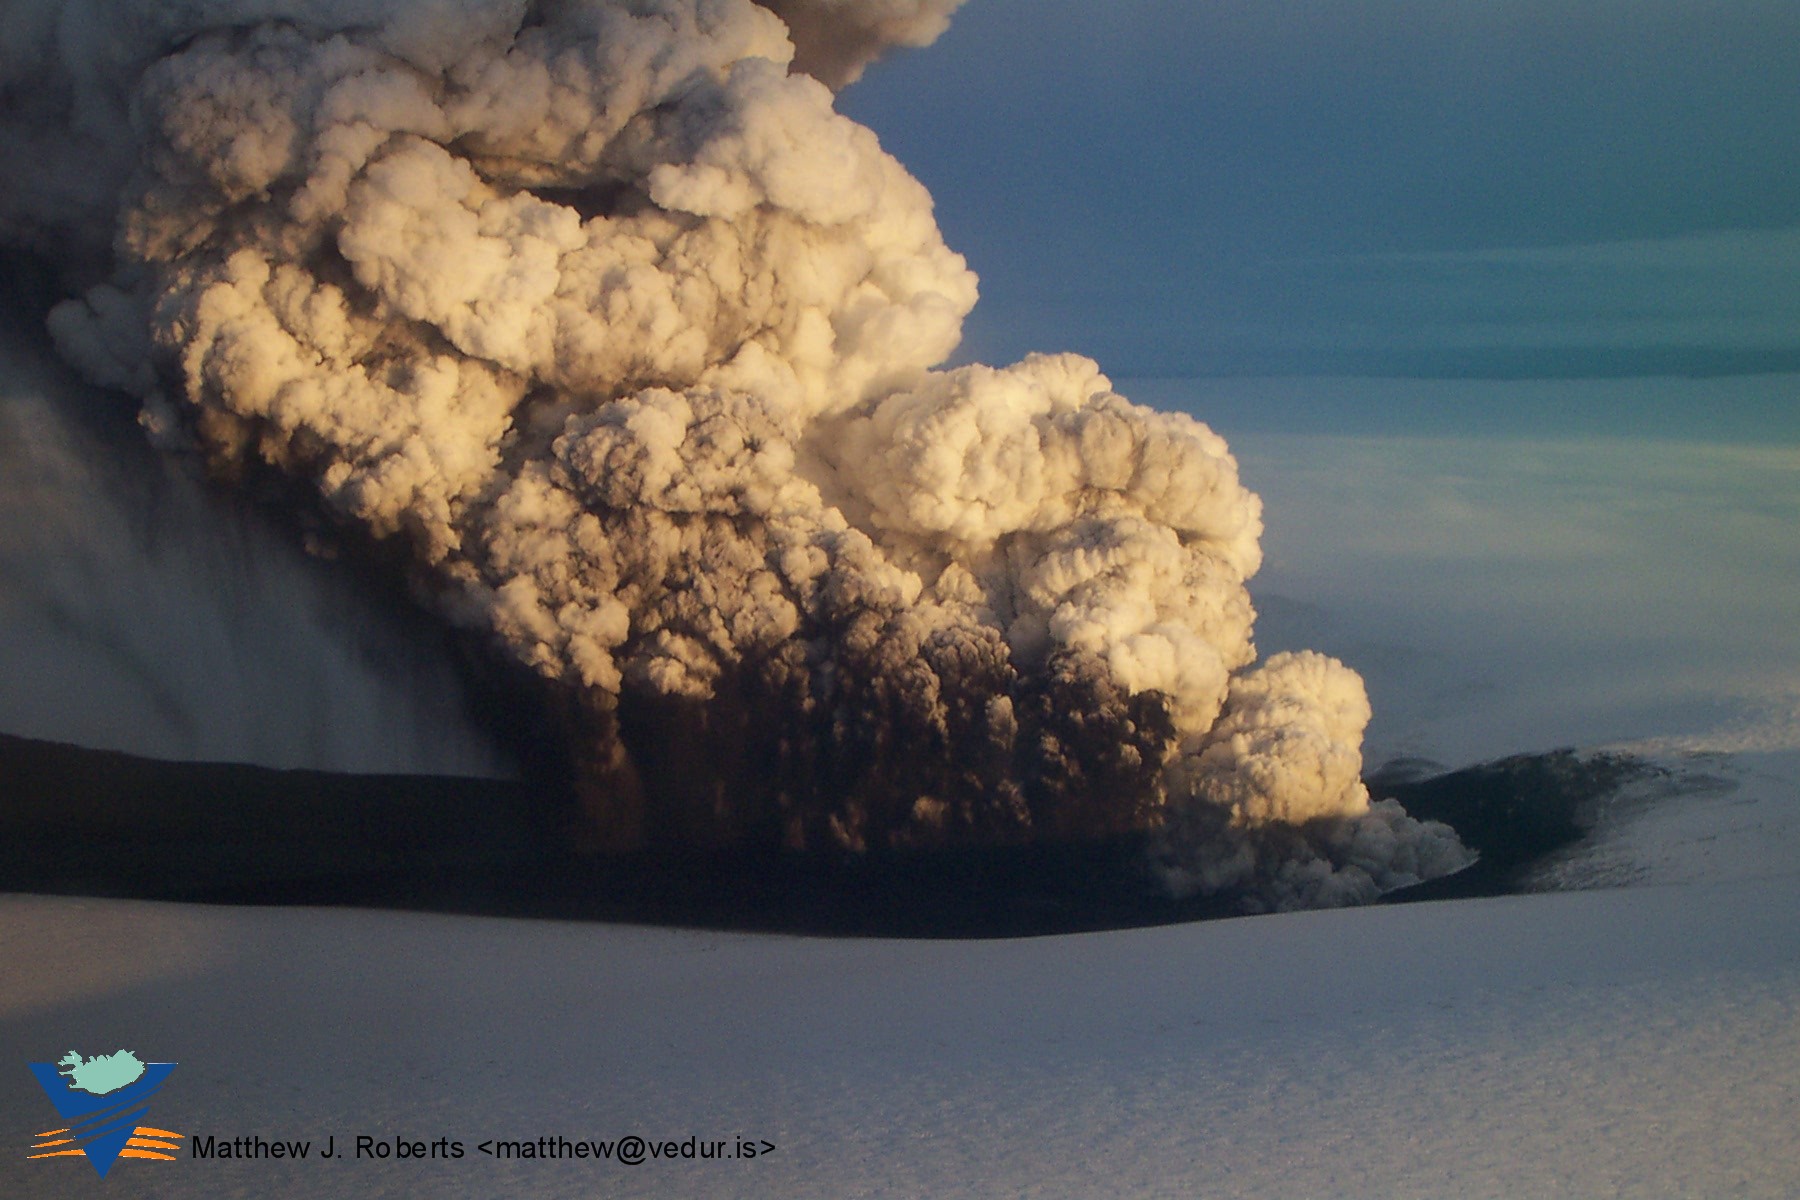
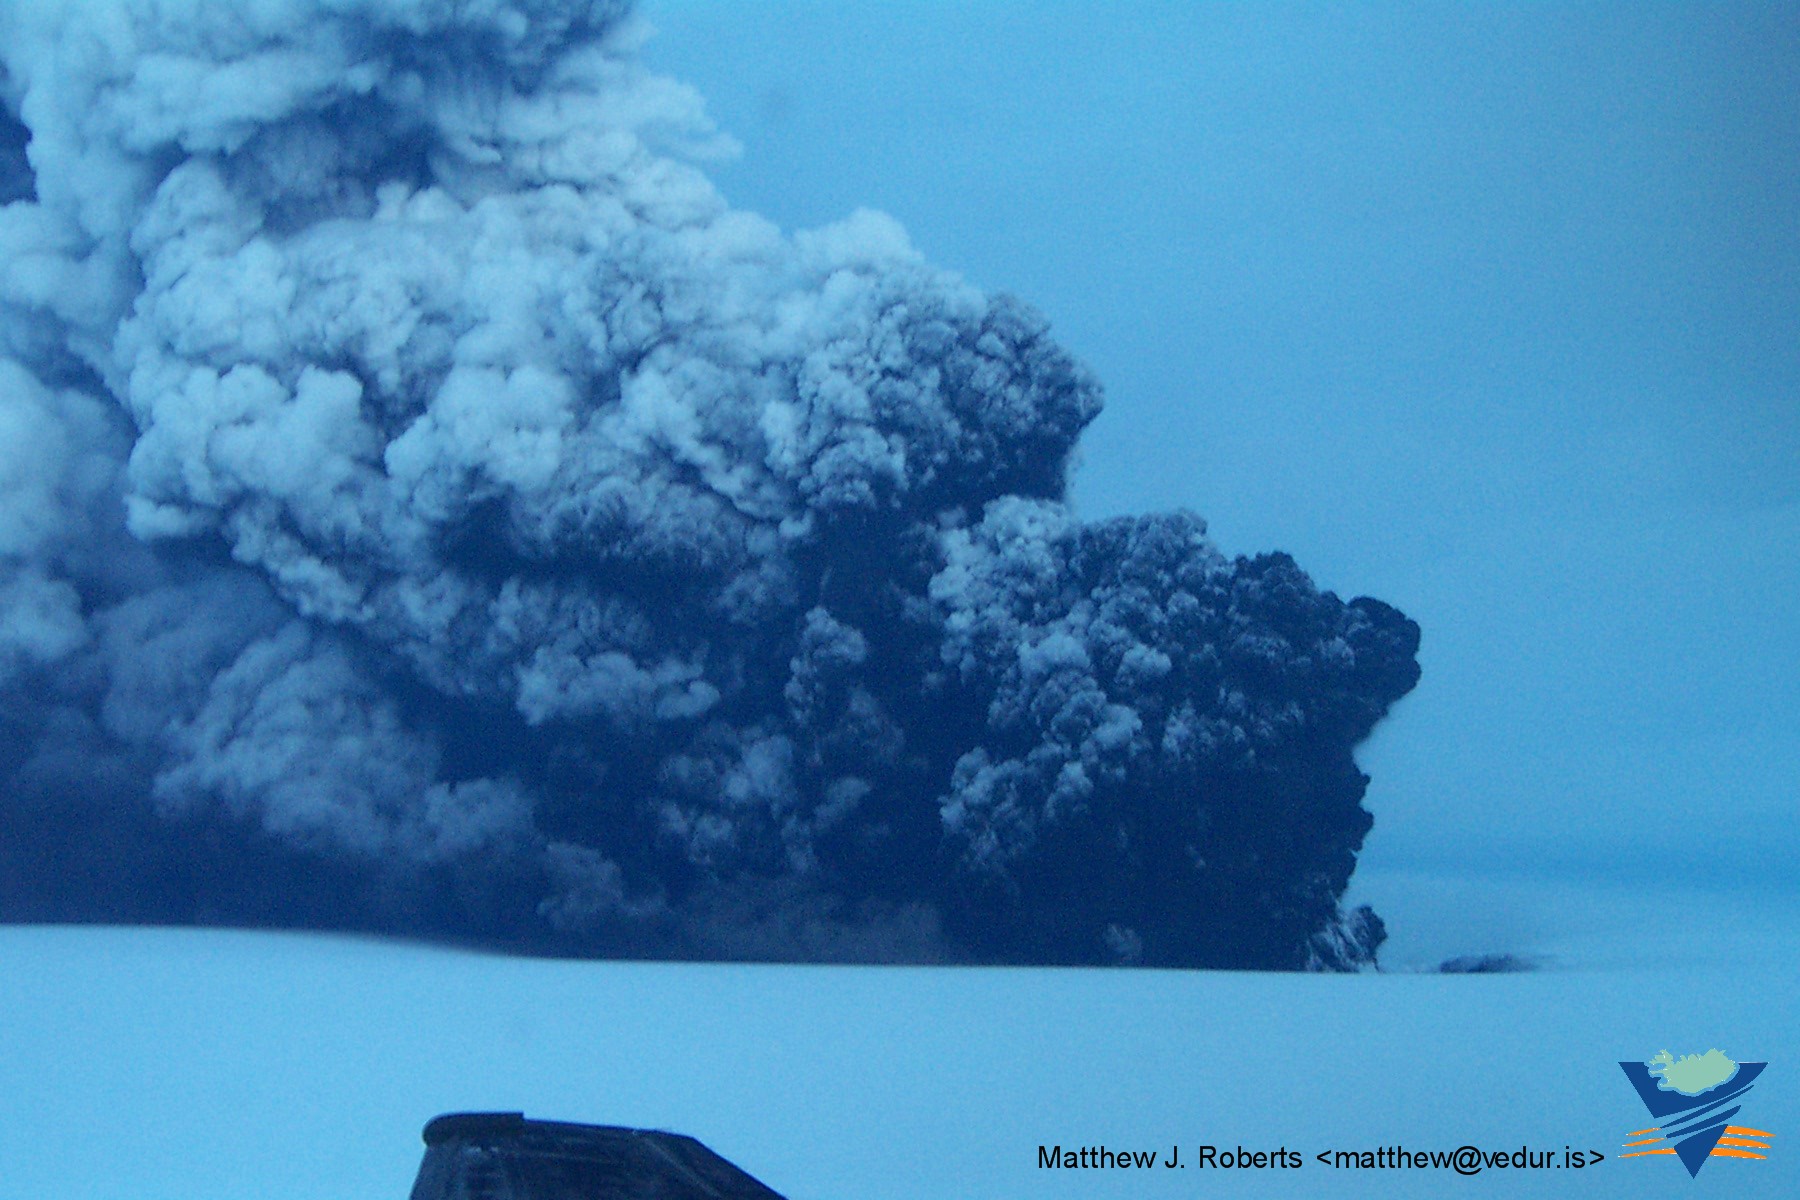
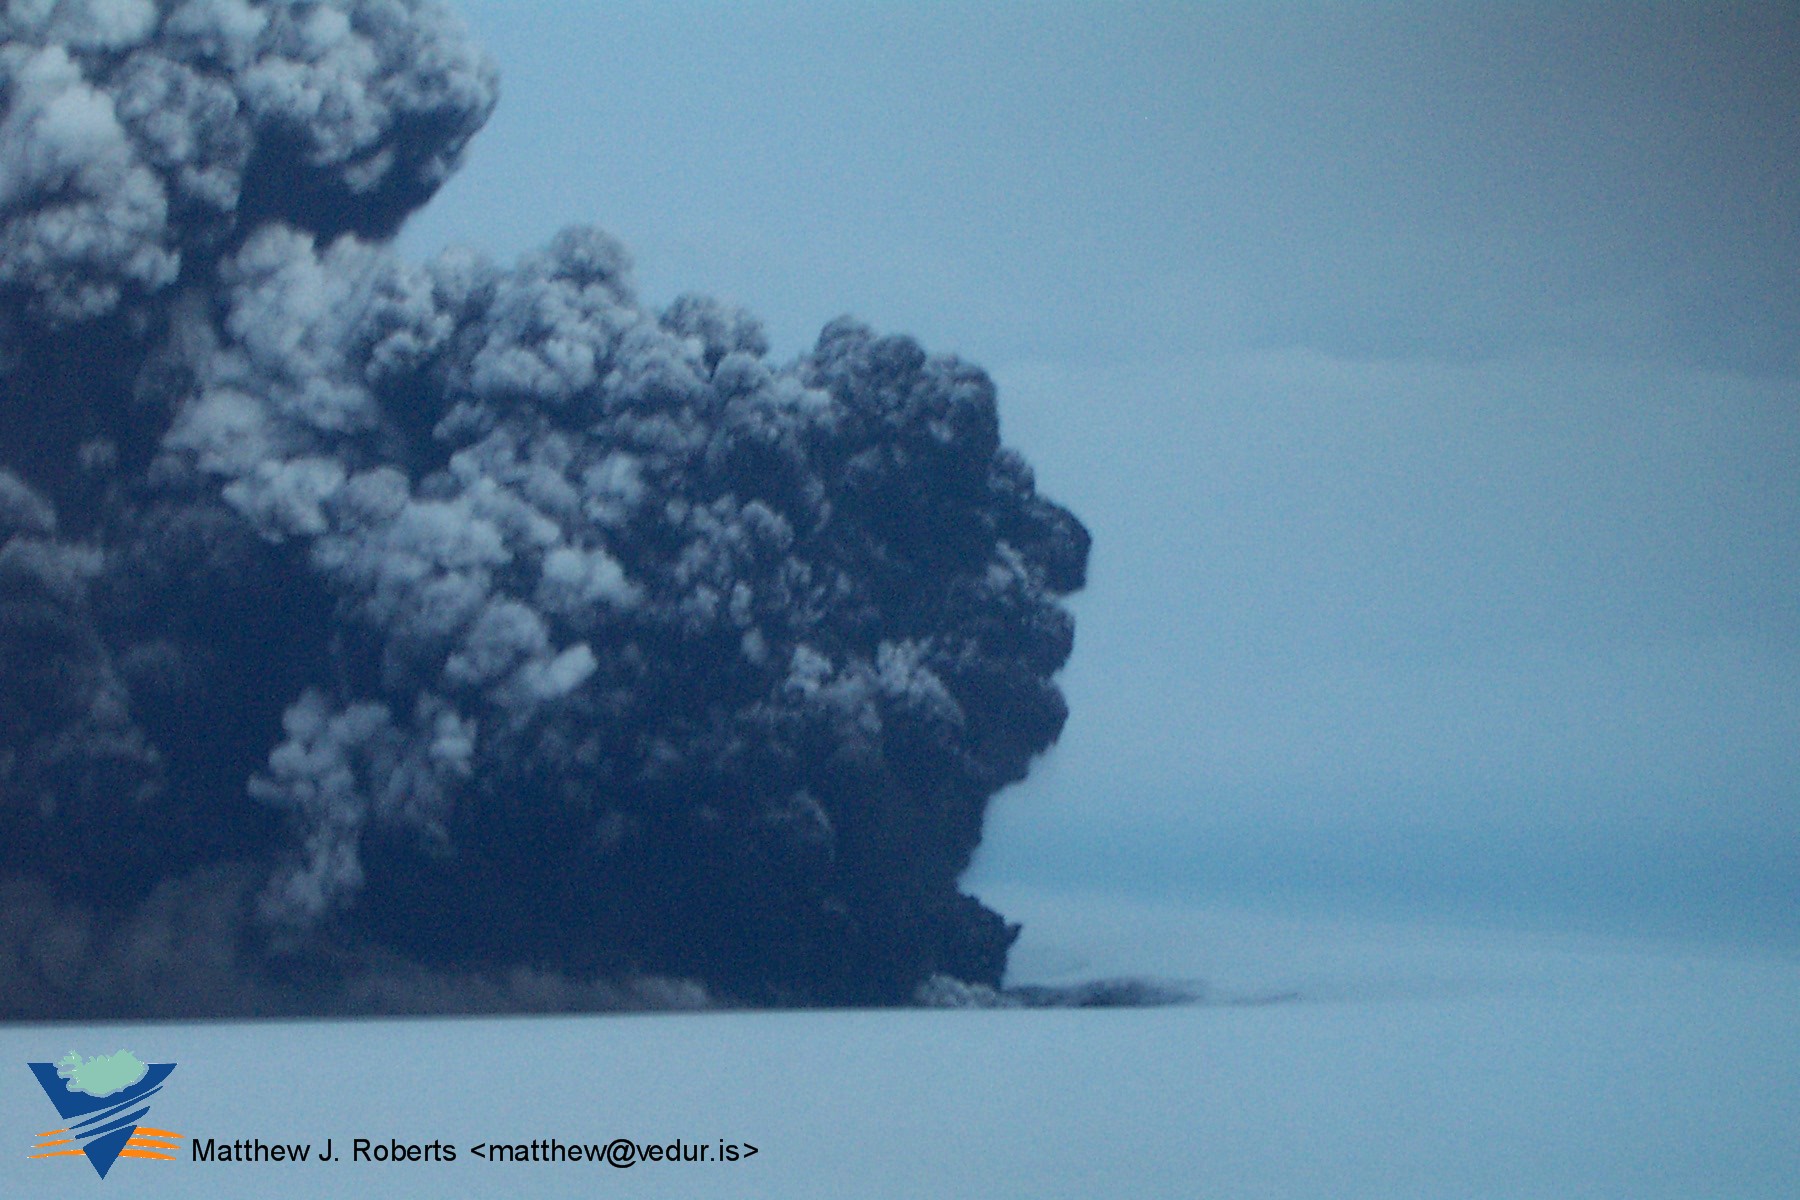
Photographs from the eruption of Grímsvötn:
Below are photographs taken during a flight over the eruption site yesterday
(Nov. 2).
Photographs taken between 15:30 og 16:15
|
|
|
|
|
|
|
|
|
|
|
|
|
|
|
|
|
|
|
|
|
|
||
|
|
|
|
|
|
|
|
|
|
||
|
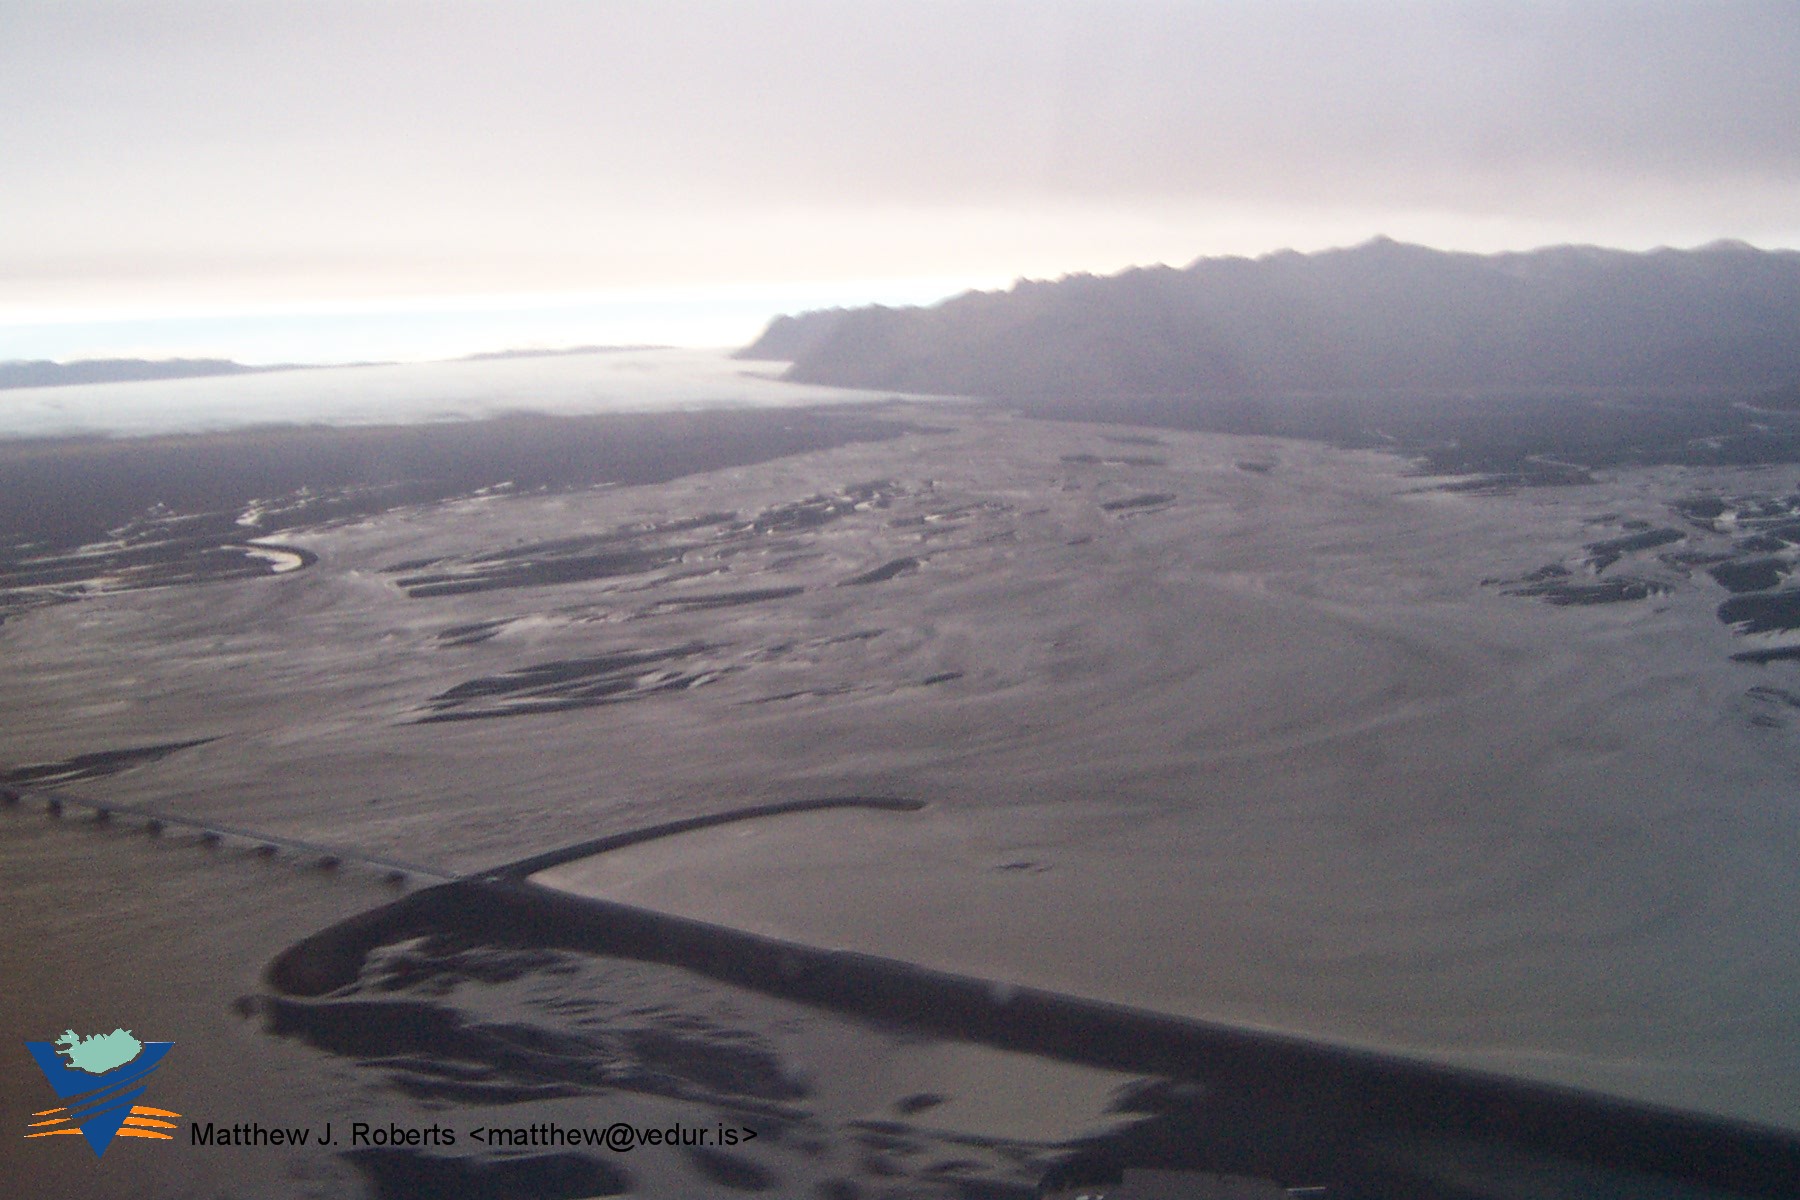
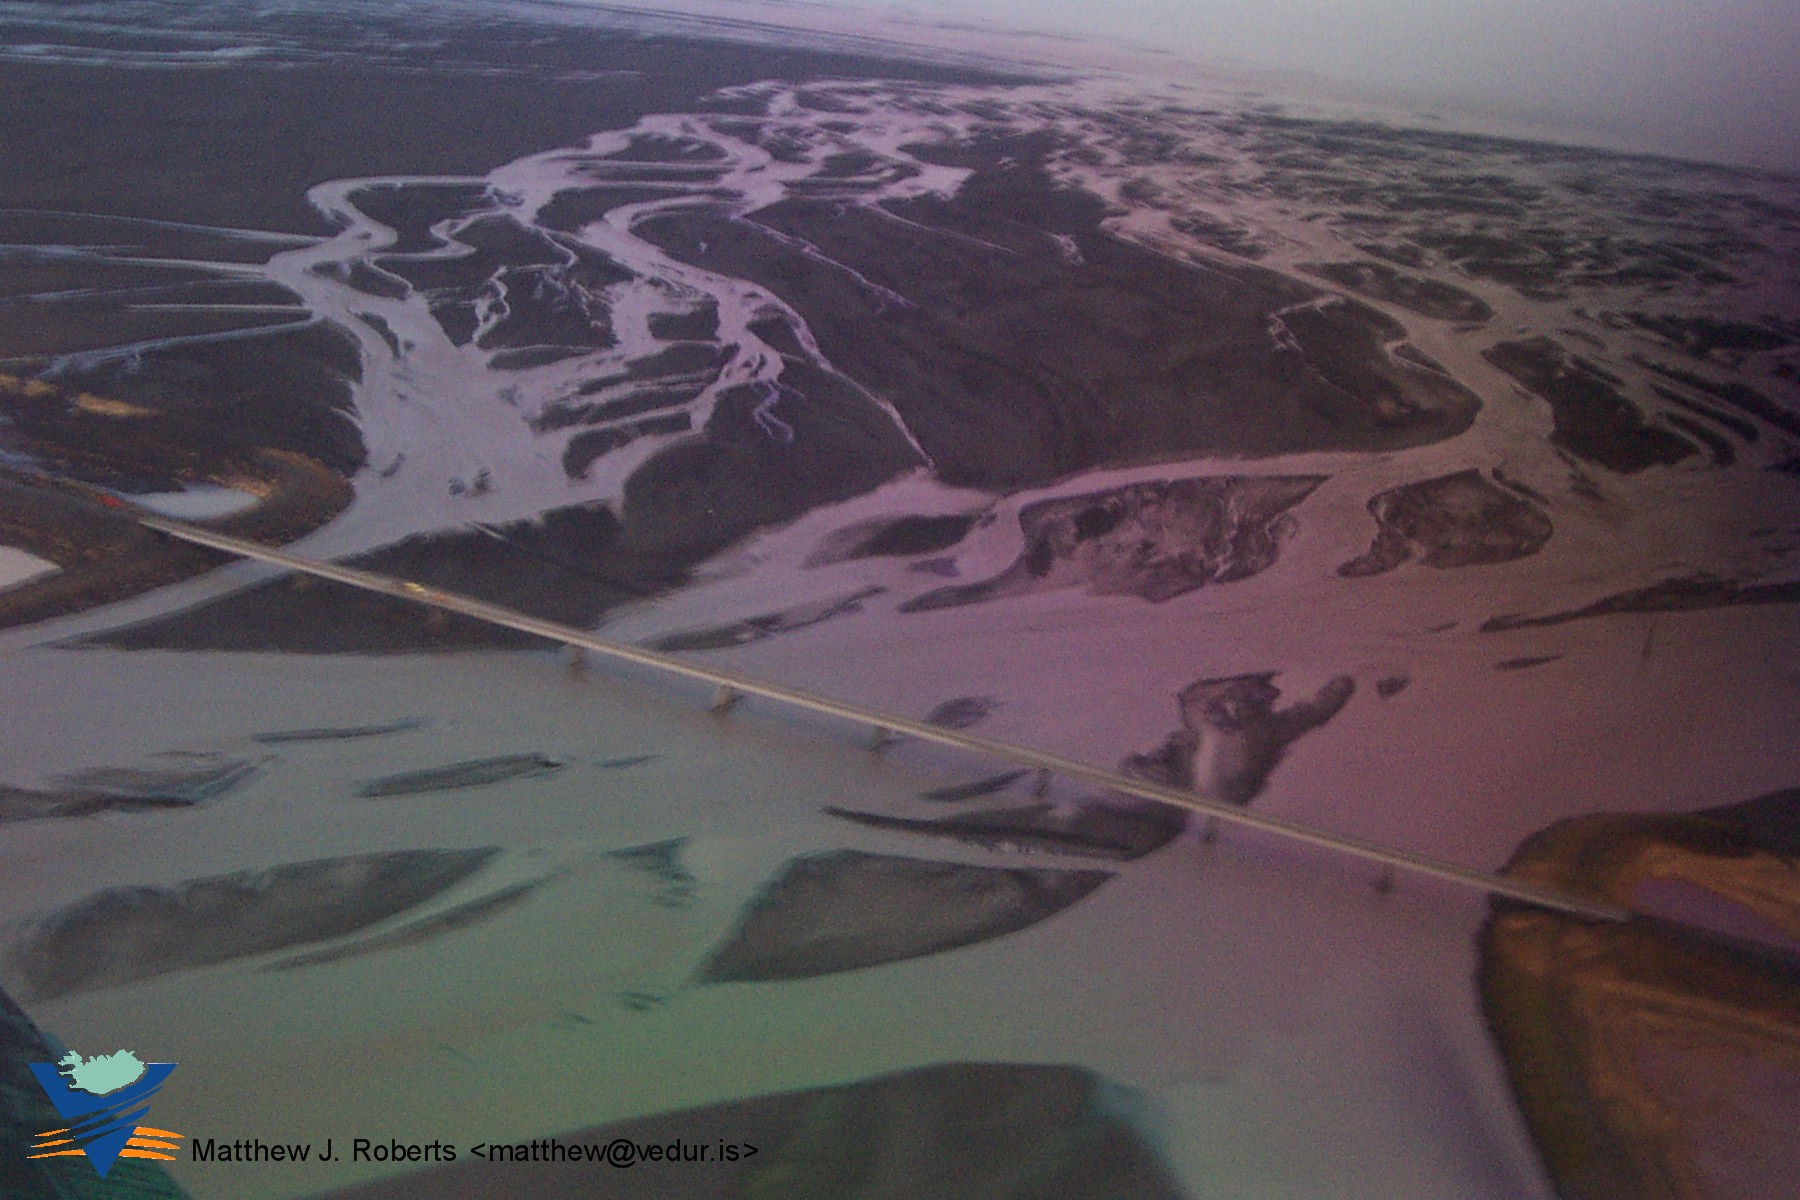
Photographs taken at 16:50 |
Skeidararhlaup 16:30 |
|||
|
|
|
|
|
|
|
|
|
|
|
|


Related Web sites:
Institute of Earth Sciences, University of Iceland (Magnús Tumi
Guđmundsson)
The
Nordic Volcanological center, Institute of Earth Sciences, University
of Iceland
Hydrological Service
BBC
Online article about the November 2004 eruption
Ludwig Maximilians Universität, München
Page last updated 19.11.2004