


Next: Hengill triple junction
Up: Plates and plate velocities
Previous: Velocities derived from data
Figure 28 shows the observed vertical velocities at the GPS stations
as in Table 6, where the effects of radome installation and equipment
changes have been removed. The June 2000 earthquakes did not affect the
vertical positions of the stations so the vertical velocities
in Tables 6 and 7 are identical. The
vertical velocities in Table 8,
obtained using data from August 2001 to December 2001, are generally
slightly lower than in
Table 6, obtained using the whole data set.
The largest differences are observed at HLID (11.5  0.7 mm/yr and
6
2 mm/yr for Tables 6 and 8 respectively).
The vertical velocity at SKRO is not reliable,
since the data may be affected by local disturbances not originating
in the crust (Section 2).
0.7 mm/yr and
6
2 mm/yr for Tables 6 and 8 respectively).
The vertical velocity at SKRO is not reliable,
since the data may be affected by local disturbances not originating
in the crust (Section 2).
All stations with significant vertical velocities are moving up relative
to REYK. This is supported by results from International Data Centers
which include REYK and HOFN in their routine processing
[SOPAC (2002)],
[MIT (2002)],
[JPL (2001)].
The study by
[Sella et al. (2002)] reports vertical velocities of
-3.4 mm/yr
1.5 mm/yr for REYK and 4.0 mm/yr
2.3 mm/yr for HOFN.
A tide gauge record in Reykjavík shows a sea level
rise of 2.4 to 3.4 mm/yr
[Einarsson (1994)], similar to the
global eustatic sea level rise. REYK is sited on the top of an elevator shaft
in a three stories high building in the University of Iceland. The building was constructed
in the 1970's and it is possible that the building is still
moving slightly, although it is unlikely (S. Erlingsson, personal communication
2000).
Figure 28:
Calculated vertical velocities (in mm/yr) for the permanent GPS stations, as in
Table 6, assuming REYK is fixed. Confidence limits are scaled by a factor 2 from
Table 6, shown with grey bars around the arrow heads. The vertical velocity at
SKRO is possibly disturbed by local movement of the monument.
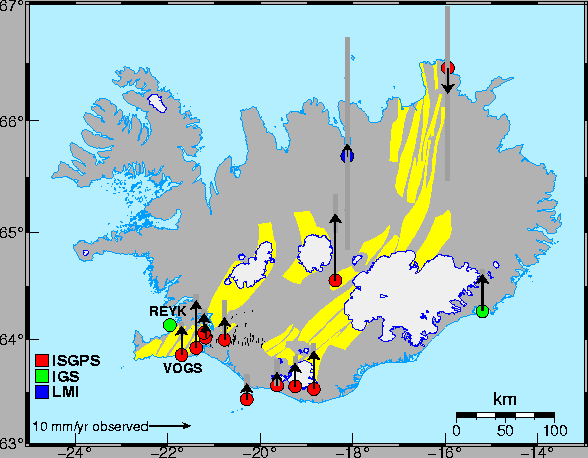 |
HOFN is sited just on the SE side of the retreating Vatnajökull glacier
(Figure 28). Previous observations and model
calculations suggest a present crustal uplift rate of 5-15 mm/yr
in the area around the glacier
[Sigmundsson (1990)],
[Sigmundsson et al. (1992)].
Thus the uplift rate observed at HOFN
can be explained by the retreating and thinning of Vatnajökull glacier.
There are no retreating glaciers near the stations in the Hengill
area and still it is evident from Figure 28 and Tables 6 and 8
that the stations in the Hengill area are moving up relative to
REYK at rates not much lower than at HOFN.
The time series (Figures 8 to 20)
show that the vertical rates seem to be fairly constant except at THEY, SOHO and
HVOL where there is a period of approximately 1 year with amplitude 5 mm to 15 mm
in the data. The stations
THEY, SOHO and HVOL move down during mid-winter to mid-summer and they move
up during mid-summer to mid-winter. These could be signs of annual glacial loading, but
a longer time series and more detailed studies are needed to verify that.
Next: Hengill triple junction
Up: Plates and plate velocities
Previous: Velocities derived from data
Halldor Geirsson
2003-03-21